Worklog analysis: Create personal Timesheets with couple clicks
Overview
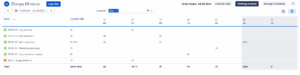
Worklog analysis can be used to see the worklogs created by you during the selected period.
On the Worklog analysis page, you can use multiple group options. For example, you can group your worklogs by projects and see how much time you logged on the specific Jira project. You can also group by issue to analyze the time booked on each issue.
To open worklog analysis please click on the worklog analysis button in the top right corner.
How to switch between different time frames?
To switch between the next and previous timeslots you can use <>
How to display the data for a custom time frame?
To apply any custom time frame, please click on the current time frame in the middle.
You will see a small calendar pop-up with some templates on the left side.

You can use any predefined time frame (today, yesterday, this or last week, this or last month) or apply any custom time frame.
To apply a custom time frame, please click on start day.
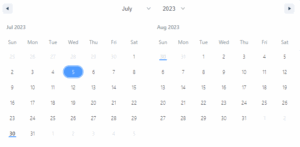
After that please click on a date, which you would like to set as the last day of your custom time frame. By hovering you will see highlighted days and what your custom period will look like.
After clicking on the last day, the whole period will be highlighted in blue.
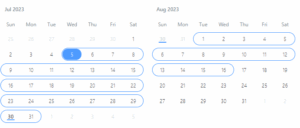
Please click outside the pop-up to see the data according to the new time frame.
How to change the default group option?
To apply any other group option, please
-
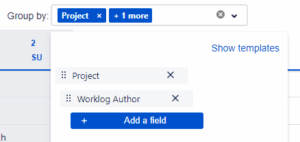
Click on Group by field.
-
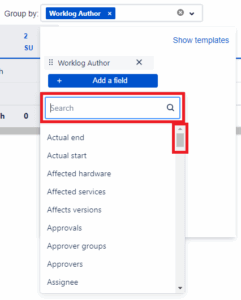
After clicking on it, you will see the current hierarchy of group options with the button “+ Add a field”. Please click on it.

-
Find the necessary group option in the dropdown or type the group option name in the search field to find it faster.
-
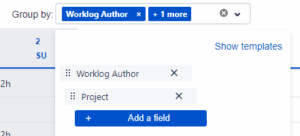
Choose an option by clicking on it.
-
You can drag and drop an option to order the list according to your needs.
-
Click outside the pop-up to close it and see the statistics.
Please note, it is not possible to add more than 5 grouping levels. “+ Add a field”-button will disppear after adding the 5th group option.
How to export the data?
To export the table, please click on the export icon in the top right corner and choose the necessary export format.
After that file will be downloaded to a local path.
How to see additional worklog details?
Some group options sum time and show the total spent per day. For example, if you apply the following group option: Worklog author – Project, it will add up worklogs added the same day to the same project. To see the single worklogs, you can click on the respective cell.

You will see the window with the list of worklogs added to this day to this project.
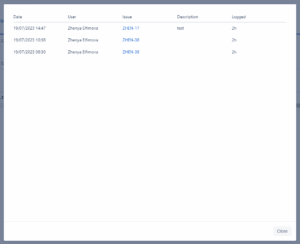
If you need any additional details, you can open the respective ticket by clicking on the issue link in the Issue column.
Additional table settings
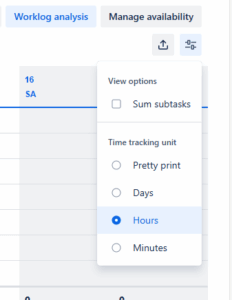
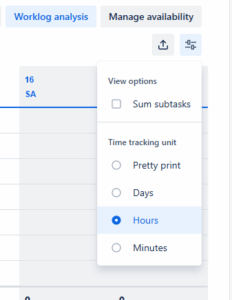
You can switch between multiple time tracking formats or sum subtasks by selecting the respective checkbox in the gear icon options, available in the top right corner.