Jira Service Management Reporting with examples | Actonic
We have outsourced our Atlassian licensing and services business to the newly founded Seibert Solutions GmbH. Actonic's products will be further developed under the usual name.

Successful Jira Service Management Reporting with Examples


5
(7)

Customer satisfaction is at the heart of every successful company. Satisfied customers are loyal, recommend the company to others, and thus contribute to long-term growth. But are your customers really satisfied? What are the best metrics to determine customer satisfaction? And thereby find ways to successful service management?

In our article, we dive into the world of Jira Service Management Reporting and show you how you can take customer satisfaction to a new level with our ITSM reports. Discover the power of data and get valuable basics for optimization decisions that make your customers happy.

What is IT Service Management?

IT Service Management (ITSM) includes planning, implementing and managing and IT services in an organization. These services also involve responding to customer inquiries. After all, first-class products are not everything. The service around the products must also be right to ensure customer satisfaction.

Using best ITSM practices and reporting helps you identify potential problems early to improve your service quality.

What is a service desk or help desk?

A service desk (or help desk) is an essential function between your customers (internal users and external clients) and your IT. Here, customers can articulate their issues and questions, which are then answered and solved by the team. The service desk not only receives customer requests, but also classifies, prioritizes, assigns, monitors tickets, and acts as a single point of contact for any inquiry.

One of the most popular ITSM help desk offerings is Jira Service Management (formerly called Jira Service Desk). To help you know how to improve your support, Jira Service Management Reporting is a great way to do this.

Reporting in Jira Service Management

Jira Service Management (JSM) is a software solution based on Atlassian’s Jira platform that integrates effortlessly with Jira Software. JSM provides you with all the features you need for efficient incident, request, change, problem, release, and knowledge management. Thanks to a clear ticket system, as you know it from Jira software, support requests are created and can be quickly processed on clear dashboards.

Thanks to reporting in Jira Service Management, you get comprehensive insights into support performance of such a classic functions as service desk, application management, technical management, IT Operations, or any set-ups for DevOps, Chat Ops, and Service Swarming Teams. Tracking key metrics such as handling time or first response time helps you identify bottlenecks and discover optimization potential for your service team, ultimately ensuring high customer satisfaction.

The benefits of Jira Service Management

  • Modern ITSM ticket system for tracking support requests

  • Simplified view for your customers

  • Best monitoring of your Service-Level Agreements (SLAs)

  • Efficient management of incidents and other IT processes

  • Automated workflows and SLA management

  • Extensive reporting and analysis options

Standard reports in Jira Service Management

Jira Service Management provides you with a variety of out-of-the-box standard reports to help you gain important information about your service desk and support team performance.

The following standard reports are available in JSM Cloud:

  • “Workload Report”: this report lists the number of requests assigned to your ITSM agents and gives you an overview of their workload.

  • “Satisfaction Report”: this report lists the average customer satisfaction for your team.

  • “Rejected Requests Report”: This report lists the number of times your customers viewed knowledge base articles in the portal and found them helpful.

  • “Resolved Requests Report”: This report lists the number of JSM requests that were resolved with and without the use of knowledge base articles.

Custom reports in Jira Service Management

Standard reports in Jira Service Management allow quick reporting to stakeholders. However, they do not cover all KPIs.

Custom reports in JSM are editable, unlike standard reports. You can use them to monitor custom metrics and even create your own custom service management report. This allows you more flexibility to customize your team goals as well as measure your metrics.

Find the complete list of custom JSM reports here.

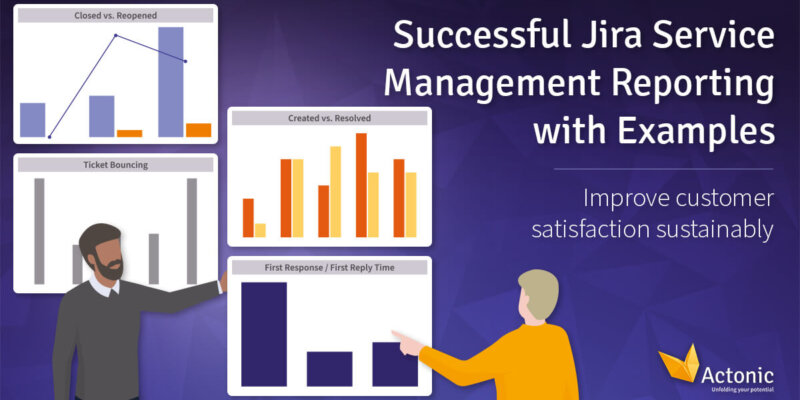
  • “Created vs. resolved”: This report allows you to track the number of created and resolved requests in the service desk over time. This gives you a quick overview of your ITSM team’s workload and efficiency.

  • “Time to resolution”: this report allows you to compare the time taken by your support team to resolve requests by their type or priority. Bottlenecks can be well identified with this report.

  • “Service Requests”: This report categorizes and displays the different types of service requests received in your ITSM project. It gives you insight into the most common types of requests and allows you to analyze trends and patterns to train your team more decisively in the future.

ITSM Reporting with Jira Dashboards

The Jira dashboard is not a standalone report in the strict sense. But it is a great way to present existing reports in Jira Service Management. This way, you and your ITSM team can quickly review service process progress and trends, and make data-driven decisions.

By visualizing your ITSM reporting on the Jira Dashboard, SLAs, incident, and process statistics can be viewed and compared at a glance. This is primarily invaluable if you manage multiple support teams and monitor projects.

JSM Reports with JQL

If you are familiar with Jira Query Language (JQL), you can create custom queries when reporting. JQL also allows you to quickly create complex filters to extract specific data for reporting purposes. In addition to immense time savings in reporting, JQL allows you to benefit from easy data consolidation that provides a holistic view of service management.

JQL Examples for ITSM Reports

If you need inspiration for JQL queries for your service management reporting, here are some examples:

  • Example 1: Creating a report about incidents created last month and still staying in “Open” status

    • JQL query: project = “ITSM [your project name]” AND issuetype = “[System] Incident” AND status = “Open” AND created >= startOfMonth(-1) AND created <= endOfMonth(-1)

  • Example 2: Creating a report about service requests created last month and still staying in “Open” status

    • JQL query: project = “ITSM [your project name]” AND issuetype = “[System] Service request” AND status = “Open” AND assignee = “Agent name”.

Jira Service Management Reporting with custom reports

So, if you want to run an efficient and successful Jira Service Management Reporting ensuring customer satisfaction, it is worth using a tool, which offers you the following benefits:

  • Custom reports

  • Use of JQL

  • Integration with Jira dashboards

Actonic’s Report Builder is one such tool. The reporting app is quickly and easily available for testing via the Atlassian Marketplace. In addition to agile report types, Report Builder provides you with targeted ITSM reports inspired by the standard reports you already know from Jira Service Management.

Why is it worth using Report Builder’s ITSM reports?

Here is the comparison:

ITSM Standard Reports vs. Report Images

Created vs. Resolved

One of the fundamental principles of an effective IT management and is maintaining a balanced In-Out ticket ratio. This entails managing the flow of incoming and outgoing tickets to ensure efficient resolution and customer satisfaction. While this concept is well-known to IT managers, Jira’s out-of-the-box reporting may not provide the desired level of visibility into this crucial metric.

The main purpose of the Created vs. Resolved report is to visualize the balance between incoming (created) and resolved issues within a given time period. By comparing the number of created issues to the number of resolved issues, support teams can gain a better overview of their work progress, efficiency, and workload distribution.

Actonic’s Created vs. Resolved report offers the following advantages over the standard Jira report:

Jira’s Standard Report: Created vs. Resolved

Report Builder’s: Created vs. Resolved Report

Jira Service Management Data Series report built against Created vs Resolved dates

  • Filtering by maximum one project

  • Data only in form of a line chart

  • No export function available

  • Filtering by multiple projects

  • Data optionally as bidirectional or clustered bar chart

  • Data table with direct link to the activities

  • You can export the entire report as PDF, JSON, PNG, print or CSV

Closed vs. Reopened

While it’s important to close support tickets quickly, what if they get reopened because the original resolution wasn’t enough? Our special ITSM report on Closed vs. Reopened issues gives you the tools to track, analyze and improve your service management. This helps you prevent reopened issues and increase customer satisfaction.

Closed vs. Reopened with JSM

In Jira Service Management, there is no report template that gives you such a result. You can try to create a report with report series yourself.

To do this, you need to create a Jira Service Management report for two date series:

  • Solved issues with status “Closed”, “Completed”, etc.

  • Resolved issues with the same status but ever in the “Reopened” status (if you have introduced this in your workflows).

Closed vs. Reopened with JSM

Report Builder’s: Closed vs. Reopened Report

  • Immense amount of time required to create the report manually

  • The default report in Jira does not provide insight into the rate of reopened tickets, you need to calculate them separately

  • No information about issues that have been reopened multiple times

  • Filtering by maximum one project

  • No export function available

  • Filtering by multiple projects

  • Calculation and visualization of the rate of reopened cases as a percentage.

  • Convenient selection of whether to count each reopening event or the number of issues reopened

  • Data table with direct link to the issues

  • You can export the entire report as PDF, JSON, PNG, print or CSV

First Reply or First Response Report

You know from your own experience: response does not equal solution. While a quick response time to service tickets plays a critical role in building trust, it alone does not equal resolution of the issue. To determine customer satisfaction, you should distinguish between the First Reply and First Response metrics in IT service management.

  • First Response

    • In ITSM, this usually refers to the first acknowledgement of a ticket or incident reported by a user. The First Response does not necessarily have to contain a solution or even an answer with useful information, it typically reflects the status change of the issue (ex. “New“ → “Acknowledged“).

  • First Reply

    • This term usually refers to the first meaningful response to an issue or incident, where the support team provides some form of assistance or asks for more information to clarify the issue.

First Reply with JSM

To get a standard Jira Service Management reporting for the First Reply, again, you need to create a report yourself.

First Reply or First Response with JSM

Report Builder’s: First Reply or First Response

  • By default, only the First Reply metric is calculated

  • Results are calculated based on defined SLAs – if you have not defined any, you cannot create a report

  • Filtering by maximum one project

  • Only the average is calculated, no median or percentage value

  • No distinction can be made between First Reply by automations or real users

  • No export function available

  • Filtering by multiple projects

  • Average, median, or percentile aggregations can be calculated for both metrics

  • Measurement of both metrics simultaneously for multiple projects

  • No need for complex creation of SLAs or custom fields

  • Data table with direct link to the activities

  • You can export the entire report as PDF, JSON, PNG, print, or CSV

Expand your knowledge of Actonic’s First Reply or First Response Report and get in-depth explanations. Accompanied by our step-by-step guide, you will learn how to use these metrics reports successfully to take your Jira service management reporting to the next level.

Ticket Bouncing Report

Studies reveal that every time a Jira issue is reassigned within a support team, 2 hours of valuable time get lost. Accordingly, time to resolution also increases and contact with multiple agents can also reduce customer satisfaction. Our unique Ticket Bouncing Report analyzes how often issues are passed on to other team members in Service Management. Identify where training, restructuring, or process optimization is needed.

Ticket Bouncing (ping-pong) in JSM

Unfortunately, there are no built-in reports for bouncing tickets in Jira, nor are there built-in fields for counting the number of reassignments each issue has. While we have researched some workarounds for you to measure this metric, they are immensely time-consuming.

Tickets Bouncing Report by Report Builder

This report helps IT support teams identify communication breakdowns, competency deficiencies and process bottlenecks. This prevents support tickets from being passed back and forth between teams or individuals without finding solutions.

Benefits of Actonic’s Ticket Bouncing Report

  • No time-consuming workarounds required

  • Filtering by multiple projects

  • Numerous grouping functions

    • Project

    • Issue type

    • Priority

    • Components

    • Labels

    • Environment

    • Reporter

    • Days

    • Weeks

    • Months

  • Reassignments can be counted as average, number, median, minimum, or maximum

  • Data table with direct link to the issues

  • You can export the entire report as PDF, JSON, PNG, Print or CSV

This is how your reports could look like:

Vertical diagram
Grouped by days
Vertical diagram
Grouped by issue type
Horizontal chart
Grouped by projects
Horizontal chart
Grouped by priority

Learn all the technical background on how to measure ticket bouncing, as well as relevant solutions to the reassignment problem. You can also browse our How to: Ticket Bouncing.

Conclusion: Mastering Service Management Reporting Easily

The more customers you serve with your Jira Service Management, the more unclear the performance of the support team and the satisfaction of the customers. Good reporting is essential to gain the best overview for yourself and stakeholders.

Here, the use of standard JSM reports is characterized by some limitations and complicated workarounds. Moreover, in Jira Service Management, there is no way to share reports externally.

This is where Report Builder comes into play.

Benefits of Report Builder for your ITSM

Report Builder is the quick win you need for your Jira Service Management. With the insights from the quickly generated, comprehensive reports, you can improve your service quality with targeted measures and thereby optimize customer satisfaction.

Take the first step towards optimizing your IT service and start your free trial with Report Builder today!

Next level Jira Reporting with Report Builder

  • Clear roadmaps for your ITSM
  • Manage multiple projects easily
  • Export reports to CSV, Excel or PDF
Go to Atlassian Marketplace

How useful was this post?

Click on a star to rate it!

Average rating 5 / 5. Vote count: 7

No votes so far! Be the first to rate this post.