What is velocity?
Velocity measures the amount of work a team completes at a given time (in a sprint). Velocity helps to get a clear overview of the current workload, as well as to plan future sprints more decisively.
How is the velocity measured?
There are several ways to measure velocity, such as engineering hours, user stories, and story points. Story points are often used. Here, velocity is calculated by adding up the story points of all completed sprints and dividing by the number of sprints.
For example, there were
-
in sprint 1: 4 user stories x 8 story points
-
in sprint 2: 5 user stories x 10 story points
-
and in sprint 3: 3 user stories x 8 story points
In total, for all our sprints, we have 106 story points. We divide this by the number of sprints.
106 / 3 = 35,3
So our velocity is 35 story points.
This number helps enormously with future sprint planning. If we know that we have 40-story points coming up, it’s clear that our team can’t handle that within one single sprint.
Velocity Chart
A velocity chart shows the progress of the team in a visually appealing way – also ideal for stakeholders! In Jira, measuring velocity is easily solved with Report Builder’s Velocity Chart Report. Here, we show you how to do it!
Velocity Chart in Jira: How to use it!
Step 1: To create the Report Builder Velocity Chart report, first navigate to the Reports gallery (Create report tab). Change the view, select the “SCRUM” filter, and select the corresponding report.
Step 2: Click on the reports card to open the Velocity Chart report. Then, you will see this view, which tells you to choose your own parameters.
Step 3: Choose some project in the project picker for which you want to get data. Then define the number of closed sprints associated with the chosen project. Also, you can select these options (checkboxes):
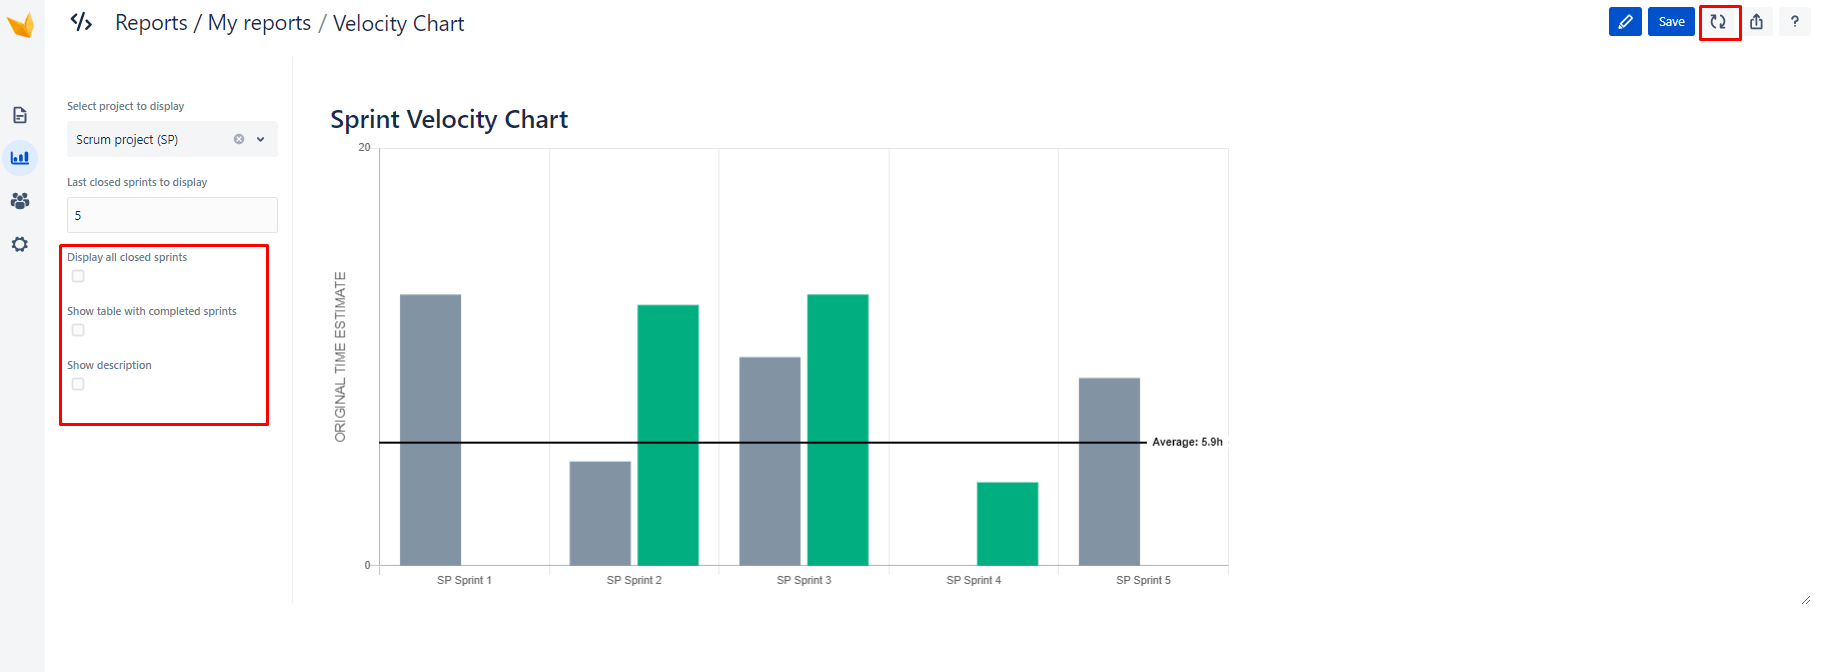
Pay attention that in order to use the values from “Last closed sprints to display” you need to uncheck the “Display all closed sprints” checkbox. If it is checked, then the value from “Last closed sprints to display” is ignored.
Step 4: Click the “Refresh” button framed in red to update the page and display results according to your chosen parameters.
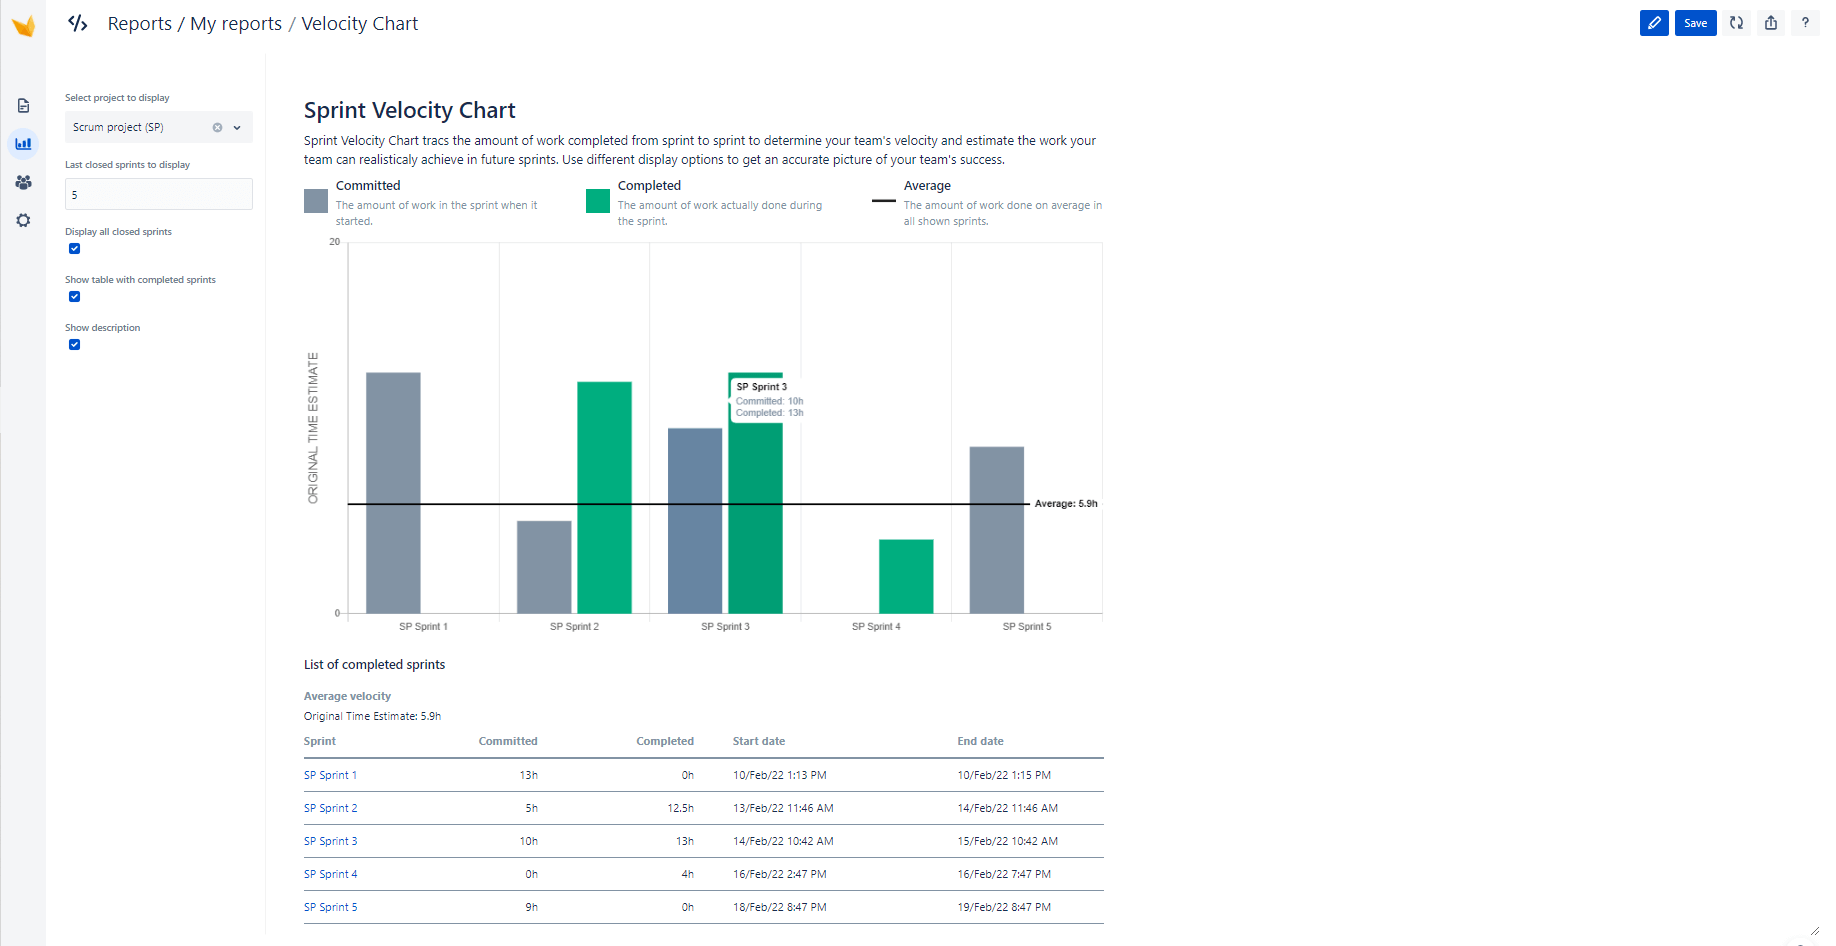
Step 5: In our example, you will see a chart with results that are a brief description of a Velocity Chart, all closed sprints of Scrum projects, and the table with completed sprints.
Pay attention to chart bars:
-
The grey bar indicates the amount of work in the sprint when it started (Committed)
-
The green bar means the amount of work actually done during the sprint (Completed)
-
The black line is the average amount of work in all shown sprints (Average)
Hovering over the bar, you can see the sprint name, committed, and completed data in hours.
Step 6: Also, you can define only the last closed sprints to display without the table of completed sprints and reports description. To do this, unselect all checkboxes and click the “Refresh” button. The chart will display the results according to the chosen parameters.
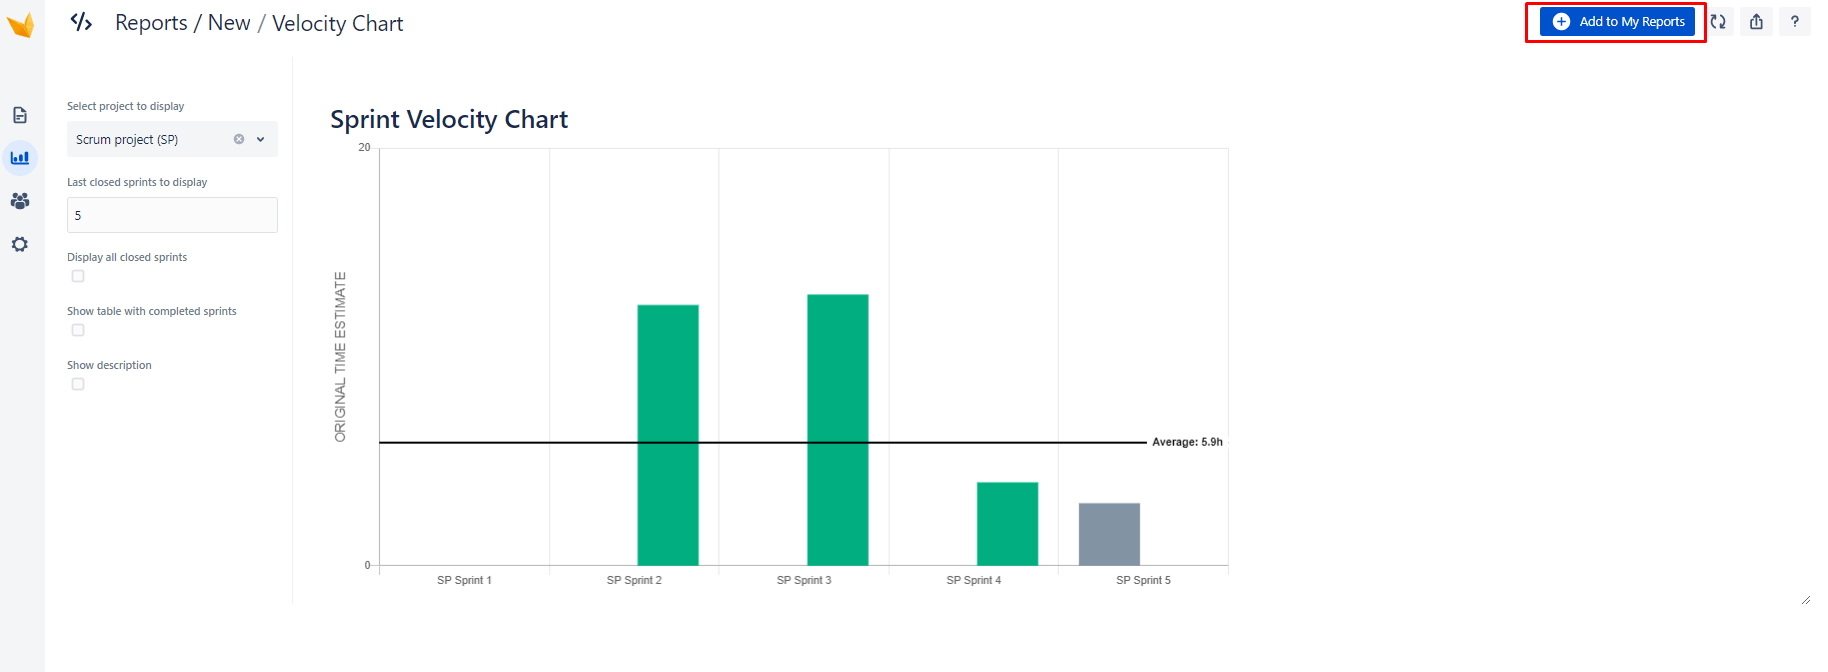
So now, you can save this report by clicking on the “Add to My reports” button.
Step 7: The Velocity Chart report is a scripted report from Report Builder. This means you can edit the report with HTML and JavaScript after saving it for the first time. For example, here, you can see how you can customize the code independently.

