Jira custom reports and why you don’t need BI tools
Overview
For admins, programmers, and other technical users, Jira’s built-in reports are like trying to recreate the Sistine Chapel ceiling in Minecraft. They allow teams to track progress, analyze quality, understand workloads, and identify bottlenecks—but only through the very specific lens that Jira provides.
What technical users want is Jira custom reports. They need to analyze, aggregate, and compare data across multiple projects and filters, from multiple perspectives, with a range of visualizations. They need to pull in data from other Jira apps being used by their company. And they need to be able to share reports with managers and stakeholders who don’t work in Jira.
But the out-of-the-box options for custom reporting are limited and don’t allow for most of these things. It’s the reason companies seek out business intelligence (BI) platforms like EazyBI and PowerBI to create custom Jira reports.
In this article, we’ll look at the pros and cons of BI tools like these, and whether a custom reporting tool like Report Builder for Jira could suit your company better.
But first…
Can’t you do ANY custom reporting in Jira?
It depends how custom we’re talking.
Among Jira’s project reports, the pie chart can be used to report on any data point in your Jira, but it’s a pie chart and its use case is narrow. And you can’t do stuff like change the colors of the segments, show/hide data points, reposition the legend, or show percentages. This is basic display customizability that a technical user should expect.
The only other ‘custom’ project reports are single level group by and time since issues reports. But these can only report on very specific things and, again, you can’t change how any of those things are displayed.
On the Jira reporting dashboard, the story is the same. There are reporting ‘gadgets’ that can pull in data from multiple Jira projects (unlike the project reports). But most are preconfigured and only show the data they’re designed to. The few ‘custom’ gadgets are filter results, issue statistics, two-dimensional filter statistics (the only custom report that lets you report in more than one dimension), and another pie chart. Again, customizability is extremely limited.
In Jira Service Management, however, it’s a different story.
Custom reports in Jira Service Management
Unlike Jira, Jira Service Management comes with a set of custom reports which can be edited, e.g. created vs resolved, time to resolution, and service-level agreement (SLA) success. These are report templates that give you a head-start but you can tweak them to suit your use case and audience. You can also create your own custom reports.
How to edit a Jira Service Management custom report
You can customize JSM’s custom report templates by adding one or more extra series. A series is a metric or set of data points, e.g. the number of service requests received on a specific day in the past week. You can assign a color and label for the series, and filter the series using standard fields or Jira Query Language (JQL).
For example, the built-in SLAs met vs breached report has two series already set up based on the default time to resolution SLA: one for all issues that met the SLA, one for all issues that breached it. You might want to edit this report to add more SLAs to the same chart. You might also want to delete the default SLA and add your own series based on the specific agreements you have with your customers.
How to create your own custom report in Jira Service Management
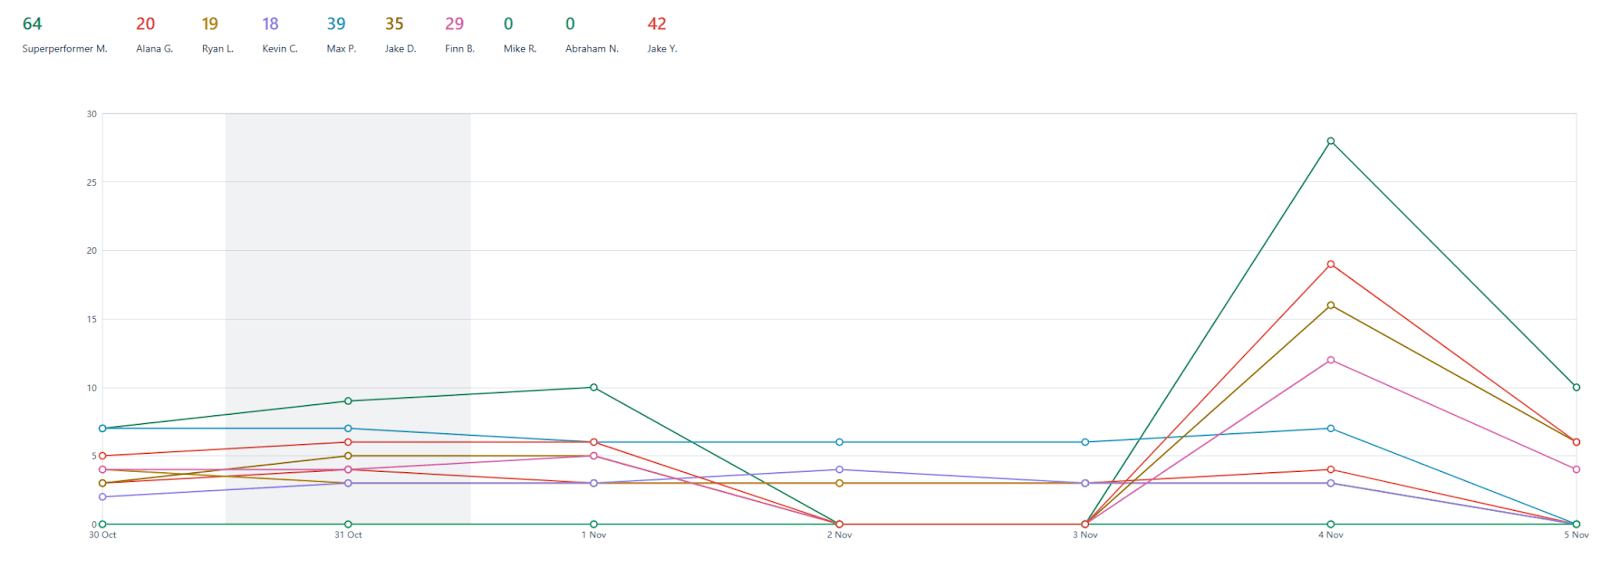
Rather than using one of the custom report templates, where the series have already been defined, you can simply start from scratch and define all the series yourself. The capabilities are the same: you add a series, give it a label, color, and optionally a filter. And then you can add more series to compare values, up to a maximum of 20.
For example, you might want to create a chart that breaks down all resolved issues by assignee, to see which assignees are most effective at resolving tickets. If you have 10 assignees, that means you need to create and add 10 series to your chart. You’ll end up with a line chart that looks something like this:
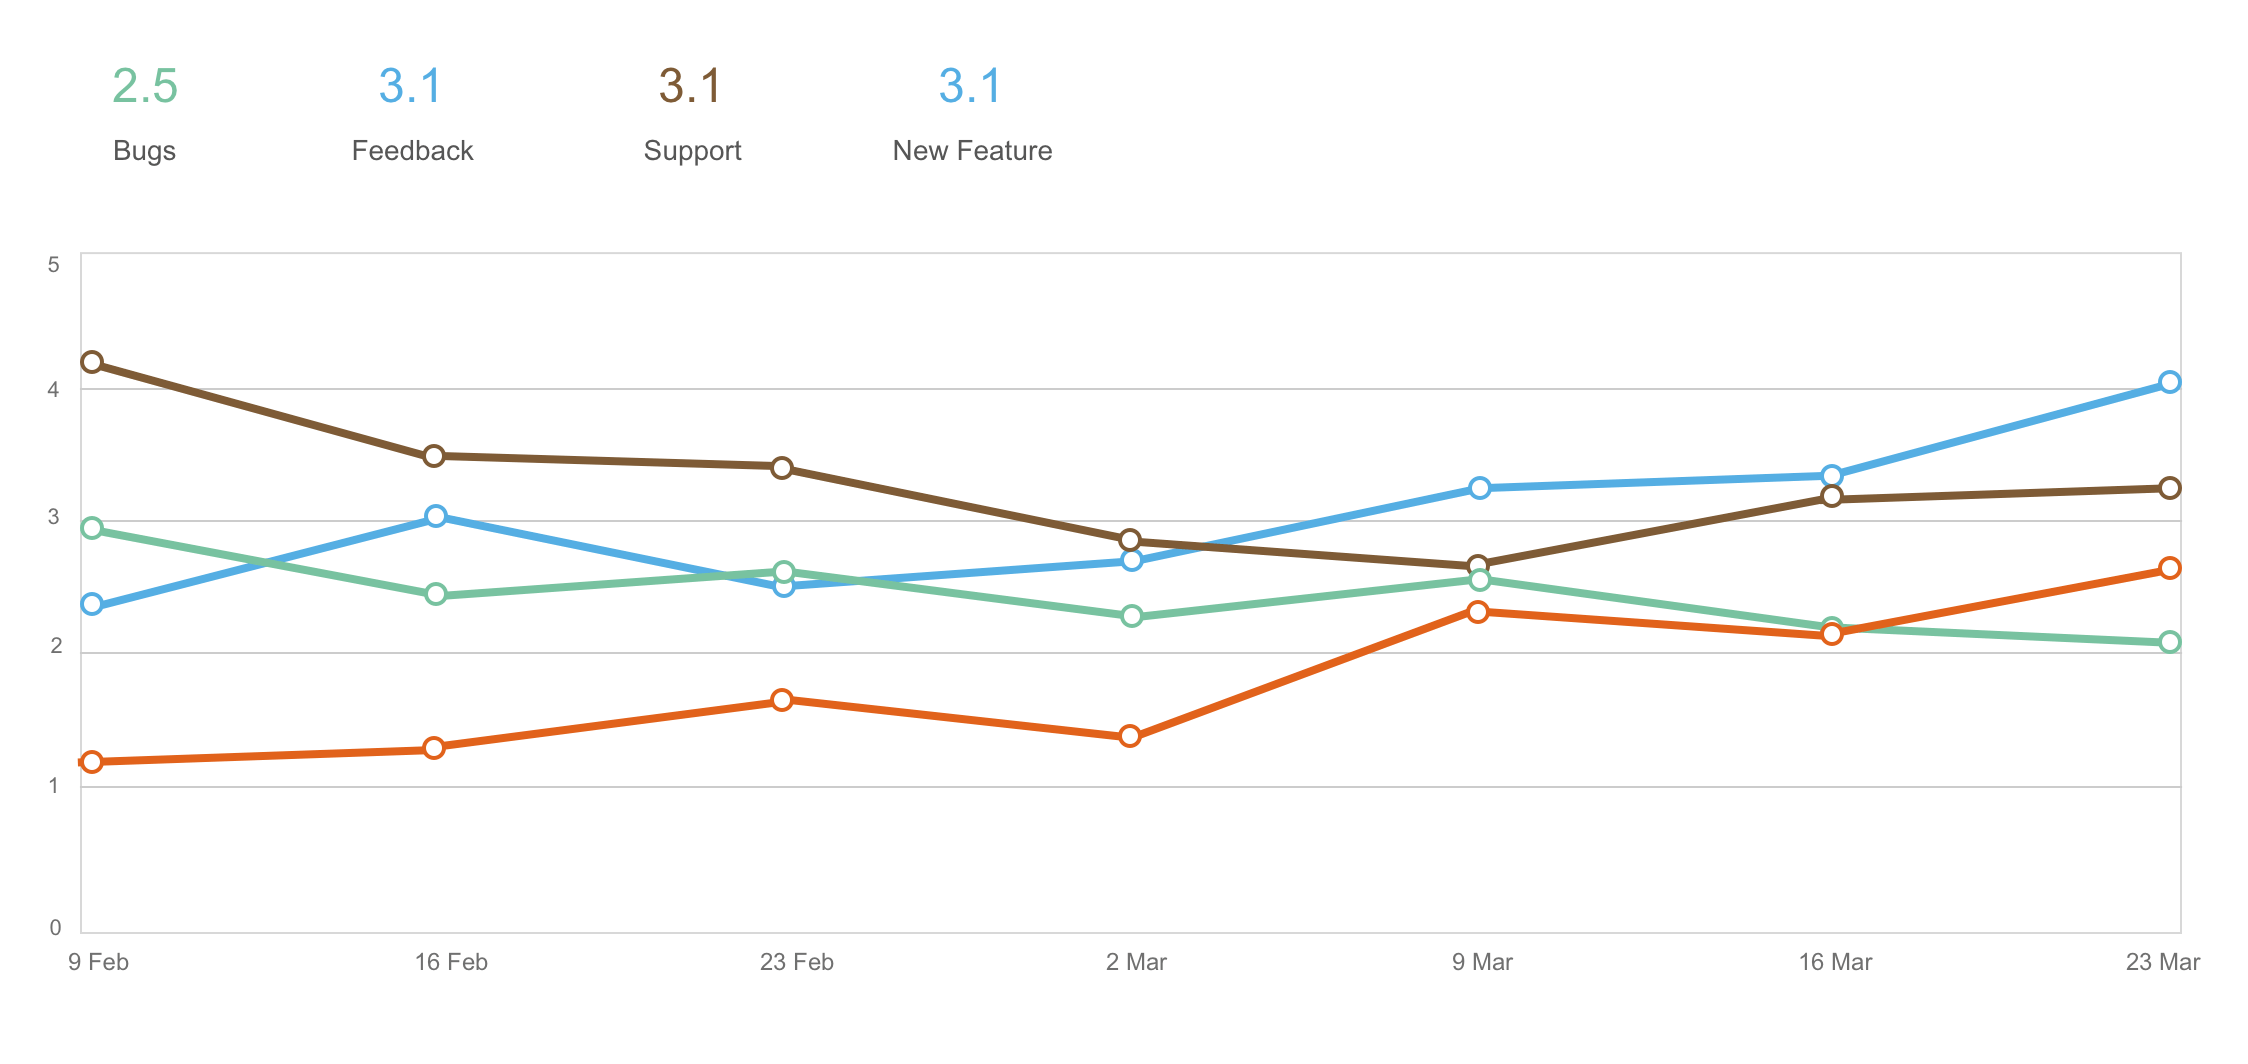
Here’s another example. In the report below, series have been created for the average customer satisfaction rating of different issue types. This helps support teams understand in which areas they’re pleasing customers, and in which areas customers aren’t so happy.
Limitations of custom Jira Service Management reports
There are a few problems with the native custom reporting functionality in Jira Service Management.
The first is, well, it’s not as ‘custom’ as many users require. The only charts you can make are line charts. You can’t make a report on data from multiple service projects or other Jira apps. And you can’t share your reports with non-Jira users because you can only export the raw data as a CSV file; you can’t export the report itself.
The second is that although it seems awesome that you can report in multiple dimensions, one of them always has to be time. In other words, you’ll only ever see hours, days, months, etc. along the x-axis and you can only measure progress over time. So, how many tickets created, how many SLAs breached, and how many requests of certain type received, over a given period.
However, you might want to see the number of open issues per customer or project and group those issues by other fields that aren’t time, e.g. priority. You may also want to display ticket volumes and resolution progress across all service projects, customers, products, and assignees in the same report.
The third problem is that the multidimensional reporting in JSM isn’t that smart. If you want multiple time periods, assignees, request types, priorities, or whatever else on your chart, manually creating an individual series for each one is a bit tedious. You shouldn’t need to create a series for each of your assignees or request types to get them to display; that should happen automatically when you select “assignee” or “request type”. Alas, this is not how JSM custom reports work.
It’s also not that easy to create series. You can only use the predefined series that come with JSM, e.g. Created, Average Time to Resolution, and Average Rating. Then you have to apply specific filters using JQL to get the data you want.
All in all, it’s a laborious process.
How to create JSM custom reports with Report Builder for Jira
Report Builder for Jira is an advanced Jira reporting and data analysis tool that functions as an alternative to using an external business intelligence platform for custom Jira reporting (we’ll explain why shortly).
It is a way of making the reports you really want to make, that convey specific messages in the best format for your audience. It also overcomes all the above mentioned limitations of custom Jira Service Management reports.
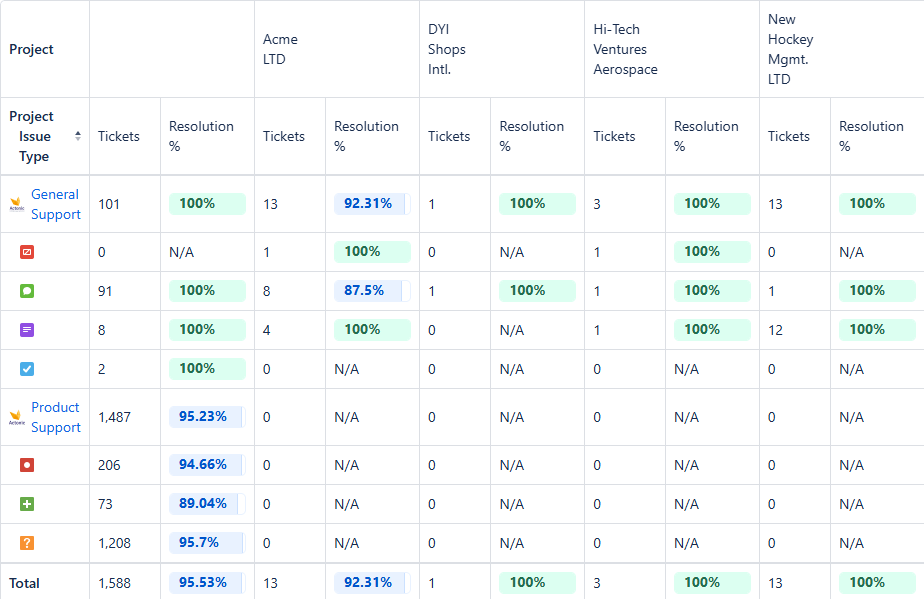
So where JSM’s custom reports force you to report against time, with Report Builder for Jira you can measure progress against whatever metric you like, all in one place. For example, you can create a single report to analyze all of your Jira and JSM projects, total ticket counts, progress on their resolution, and which customers reported these tickets.
Multidimensional reporting in Report Builder is also a lot smarter and quicker. If you want a chart to show which request types are the most popular, or a chart that shows which assignees are performing best, you don’t have to create individual series for each request type and assignee. With Report Builder you simply select “request type” or “assignee” and the tool will automatically display all request types and assignees on your charts. No complicated JQL filtering required either.
Finally, JSM reporting with Report Builder offers the levels of customizability that programmers and admins expect. You’re not limited to simple line charts. You can report on data from multiple service projects and other Jira apps, and you can export a whole report as a PDF, JSON, PNG, print or CSV to share it with non-Jira users.
You can also use JavaScript, HTML, and CSS to fully customize any reports you make using Report Builder’s suite of templates. Alternatively, you can use the app to code a report from scratch, again using JavaScript and HTML.
ℹ️ For more information, have a read of our in-depth guide to Jira Service Management reporting with examples.
Are BI tools the best option for custom Jira reporting?
Certainly, most companies trying to make Jira custom reports think it is. And indeed, tools like EazyBI, Tableau, and PowerBI are very powerful. You can report on basically anything, and visualize it however you want.
But there are some downsides. The first is that business intelligence tools like PowerBI and EazyBI are either external to Jira or rely on external databases. You’re building reports in a separate platform and therefore your data has to be imported from Jira to an external database, so it’s always slightly out of date. Second, for PowerBI and Tableau you’ll need a 3rd party integration tool to import the data—yet another tool to buy and manage. Third, all data has to be carefully configured first and a single error can cause the import to fail, which means you’ll need to develop an error protection mechanism to avoid this.
If that doesn’t already sound like too much hard work, the bigger problem is that unless you’re already a data analyst or business intelligence expert by trade, you need to be prepared to do a ton of learning. PowerBI uses Data Analysis Expressions (DAX) and Power Query Formula Language (informally known as ‘M’). And EazyBI uses online analytic processing (OLAP) cubes and Multidimensional Expressions (MDX) query language. Most regular technical users won’t have a clue what these are.
What if you could produce the same complex, multidimensional reports using a development language you already know? This is what you get with Report Builder for Jira: the same power as a BI tool, without the steep learning curve. This is because you’re able to fully customize your reports, or create them from scratch, using JavaScript and HTML. And these are consistently among the most popular and ubiquitous development languages in the world.
What’s more, Report Builder is a Jira app, which means you’re building reports in Jira with the data that lives in your Jira instance, not in a separate platform with an external database. It means you don’t have to switch to a different interface, maintain an extra database, or add reports back into Jira once they’re done. And you’re always working with live data.
Basically, you don’t need BI tools to create complex custom Jira reports to display and compare multiple variables. In fact, BI tools are often overkill. Not only do you need to learn new development languages, but you need to implement an extract, load, transform (ELT or ETL) data integration process. This involves setting sources for extraction, deciding how often to update them, setting up links, deciding how to pre-process the data, organize it, and store it, and more.
With an app like Report Builder, you don’t have to do any of this. You just select the project/s you want to report on, and make your report.
How to build Jira custom reports with Report Builder
There are three ways of building Jira custom reports with Report Builder. The first and quickest way is to use the app’s built-in report templates for agile and IT service management (ITSM), and to customize these templates to suit your use case. The second is to use the platform to code a report from scratch using JavaScript and HTML. The third is to use Actonic’s Jira report building service.
Now let’s look at each of these methods in detail.
Method 1: Custom Jira reports with templates
Report Builder offers a suite of customizable report templates. All are different to the ones already available in Jira and Jira Service Management, apart from created vs resolved issues. There is already a created vs resolved issues report available in Jira (a default report that can’t be customized) and JSM (a custom report that can be edited).
What makes the Report Builder created vs resolved template different is that it’s more customizable (more data and visualization options) and easier to create (you don’t have to configure every variable that displays like with JSM’s custom reports). Here is some more detail about how Report Builder’s created vs resolved report compares to the native versions.
The rest of the report templates offer insights that can’t be achieved natively without a complex workaround, such as ticket bouncing and closed vs reopened issues.
The report templates are a great starting point for technical users, and can save time by providing key ITSM and agile insights they may well be looking for. But what makes them particularly useful is that they’re just templates. If they don’t quite show what you need them to, you can customize them using the dropdowns. And if they still don’t suit your use case, you can edit their scripts using JavaScript and HTML and change them without limit. Which makes them as powerful as any BI tool.
Here’s a step-by-step guide to creating Jira custom reports using Report Builder’s templates.
Step 1: Navigate to the template
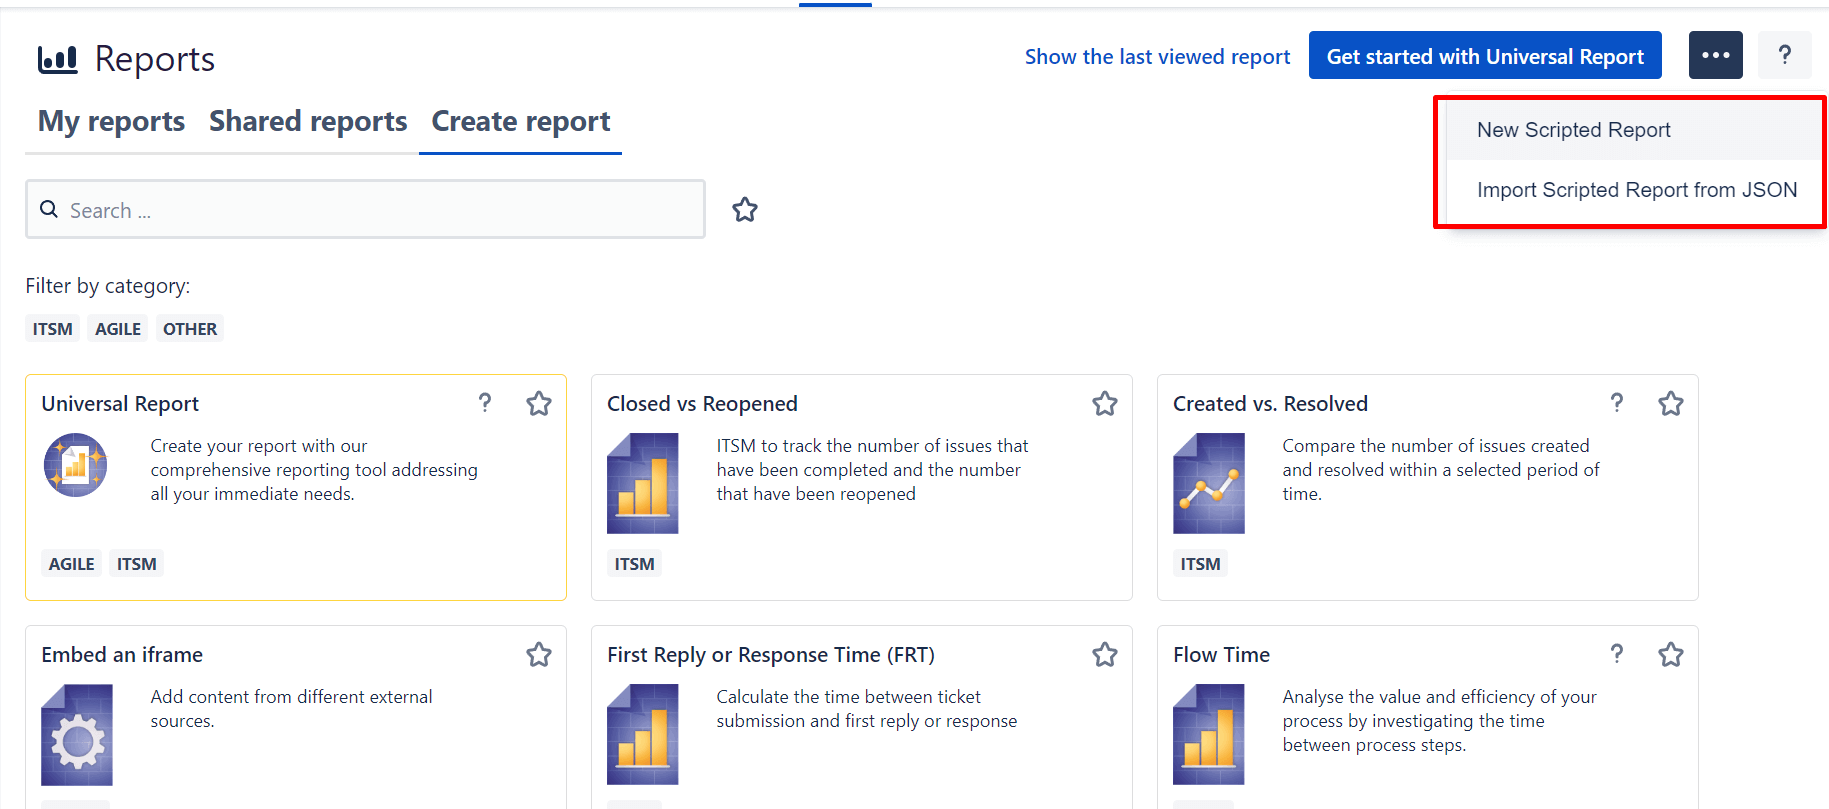
To get to the Report Builder start screen, click Apps > Report Builder.
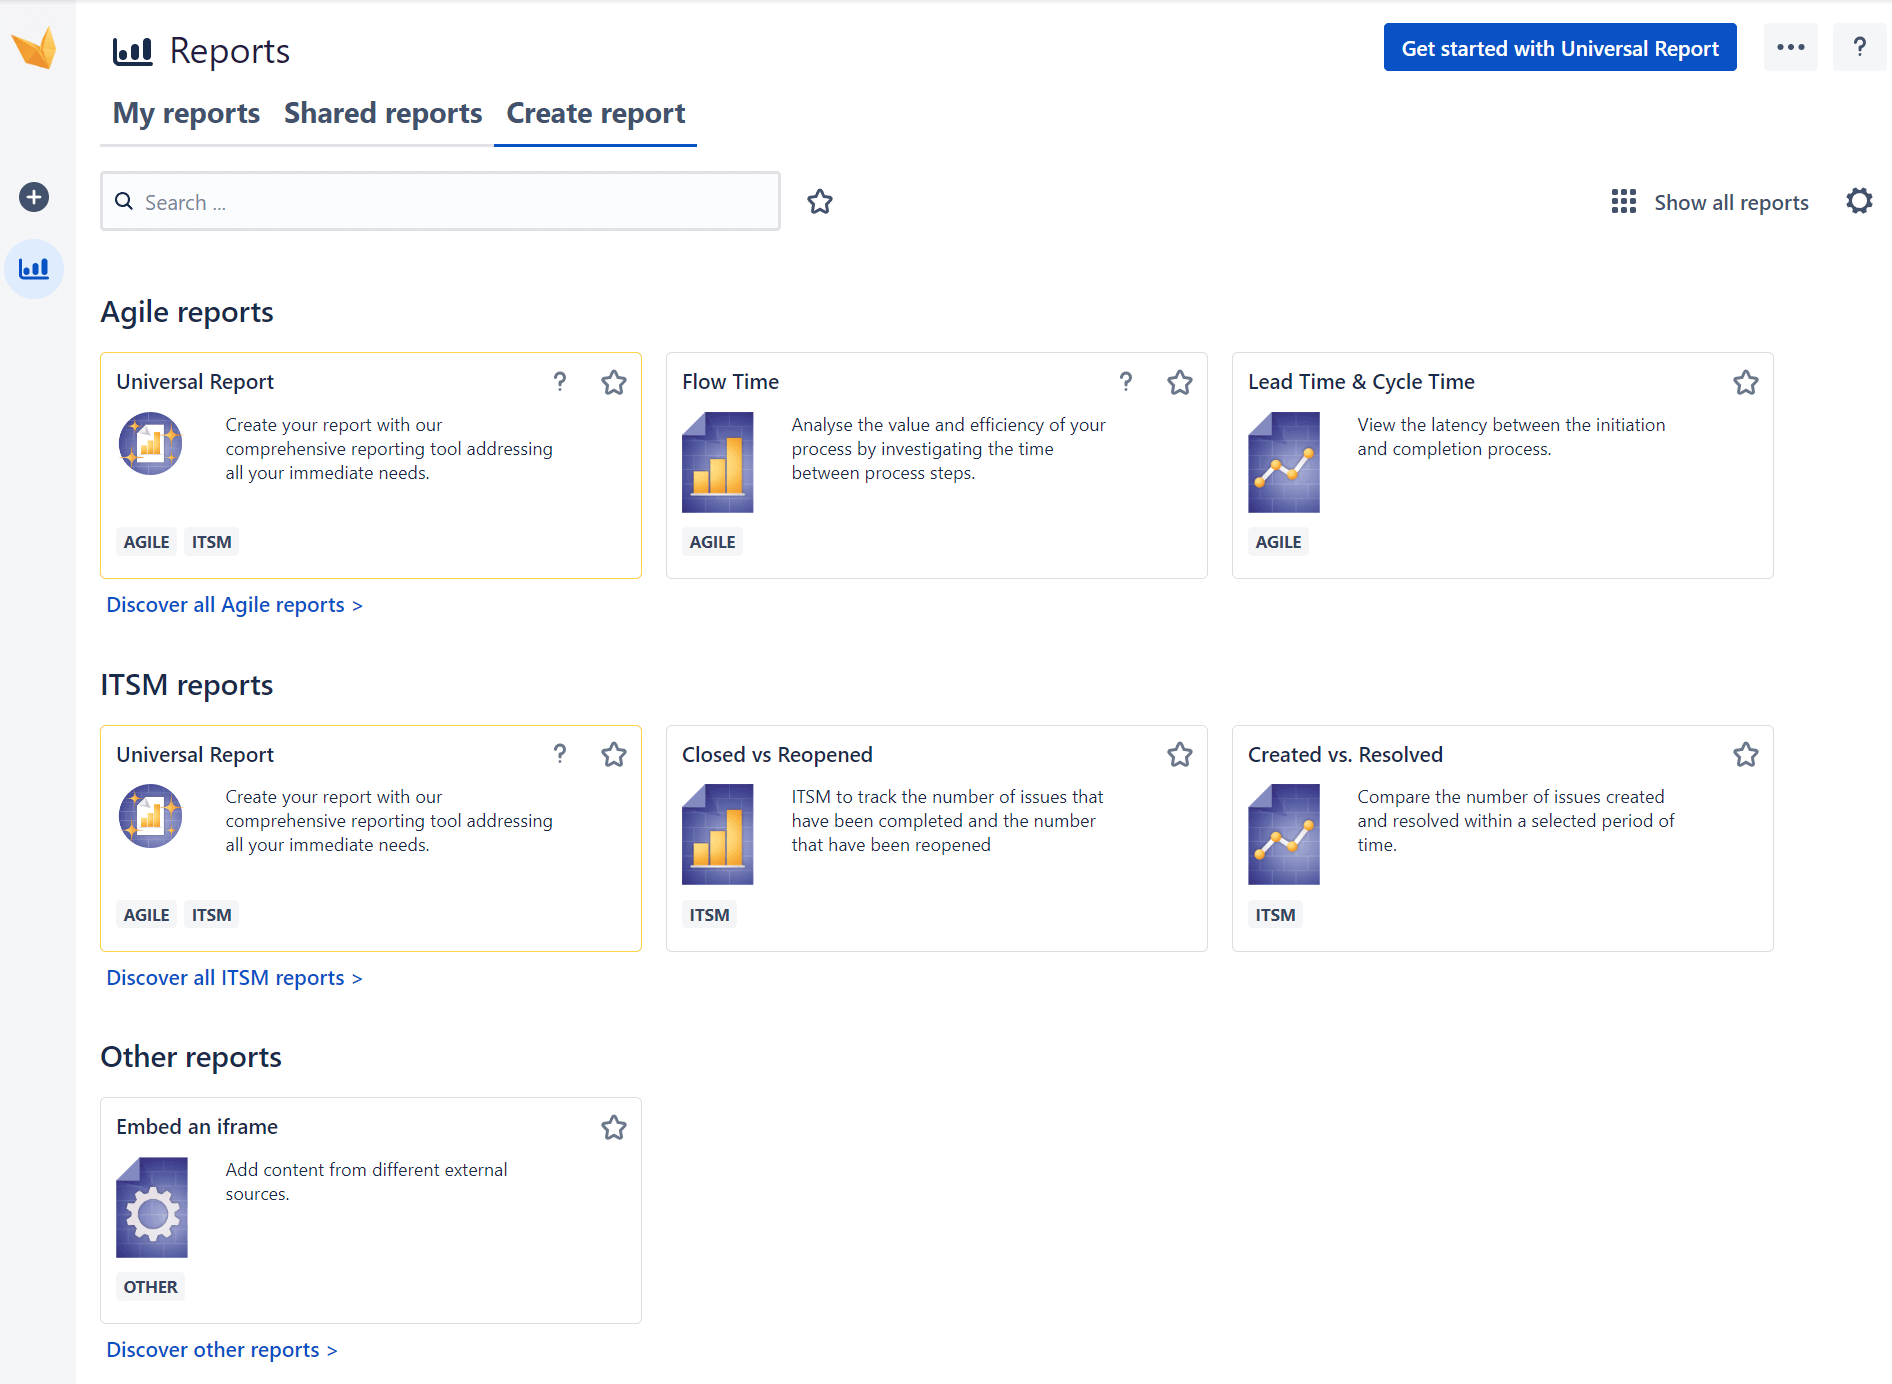
By default, you will be directed to the report creation menu. Here you will see the ready-to-use report templates sorted under “agile”, “ITSM”, and “other”.
If you click on Ungroup, all available reports are displayed without the thematic filtering.
Now, choose any report template that is the closest fit with your reporting goal. This way, you will have less manual work later.
Step 2: Adjust report parameters
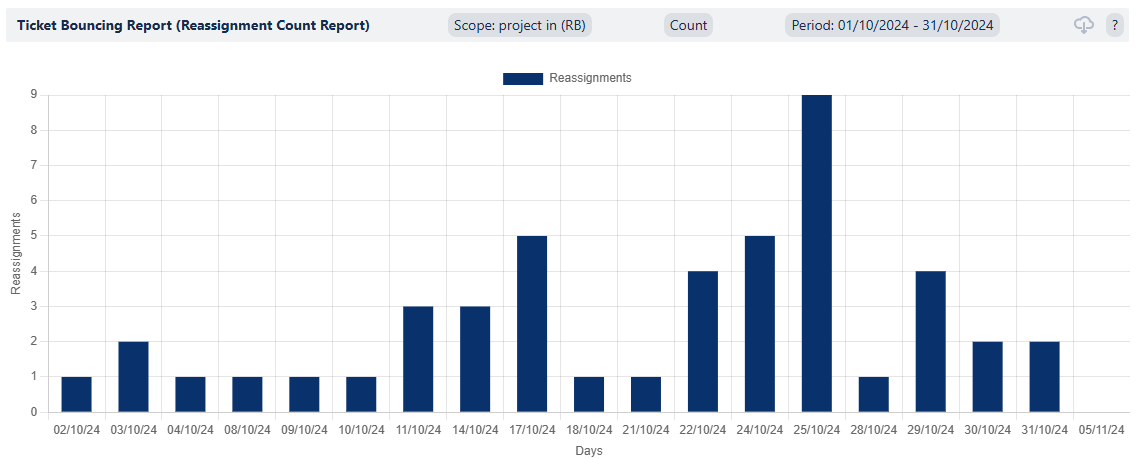
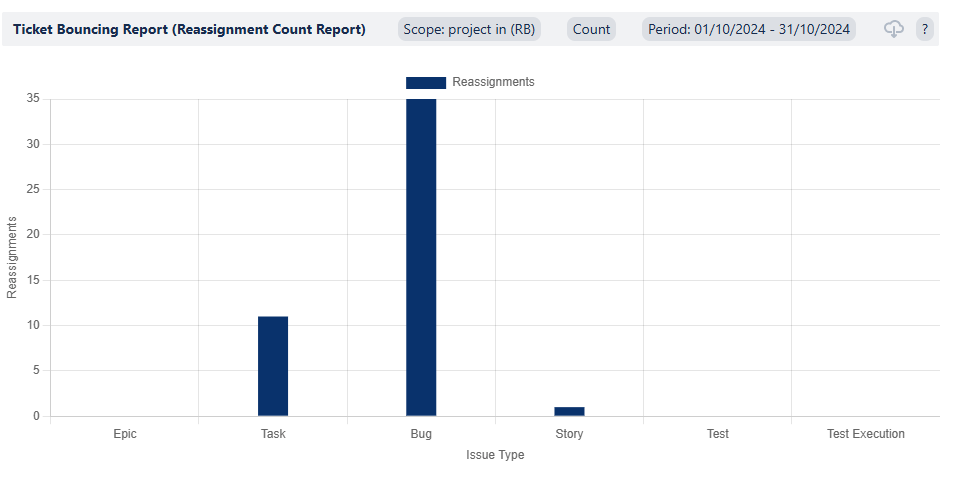
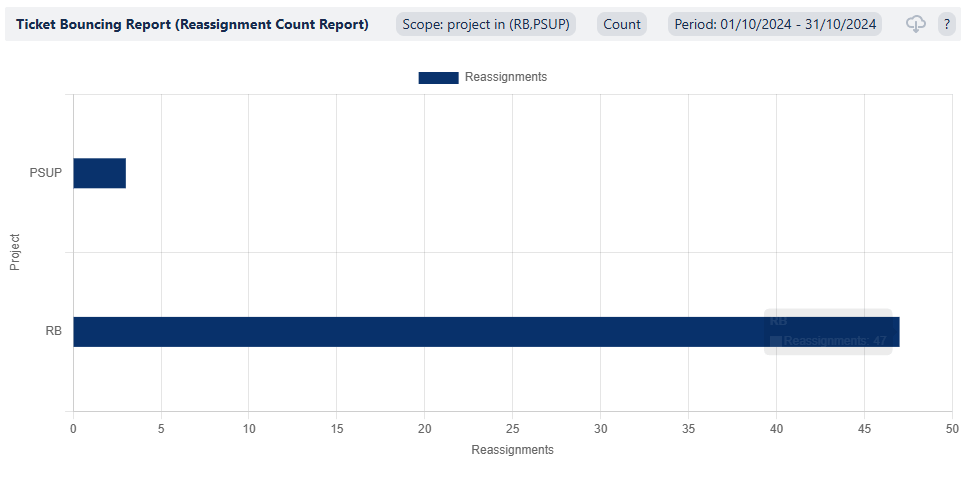
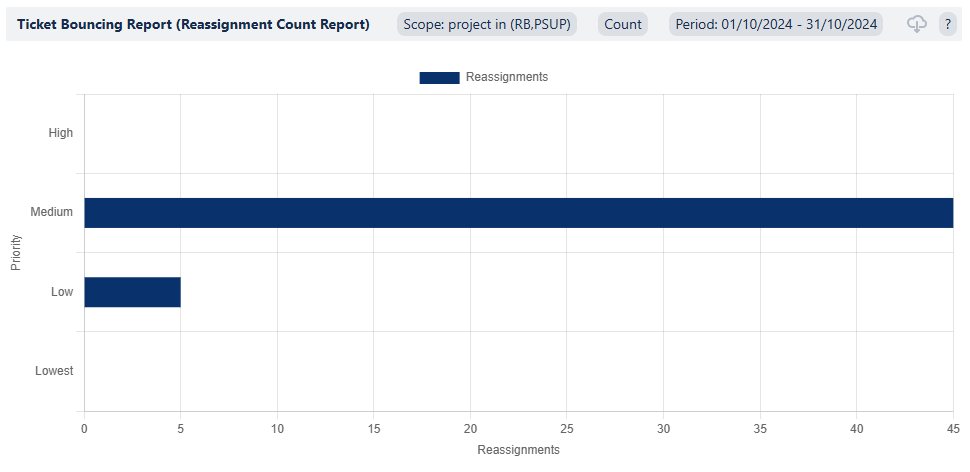
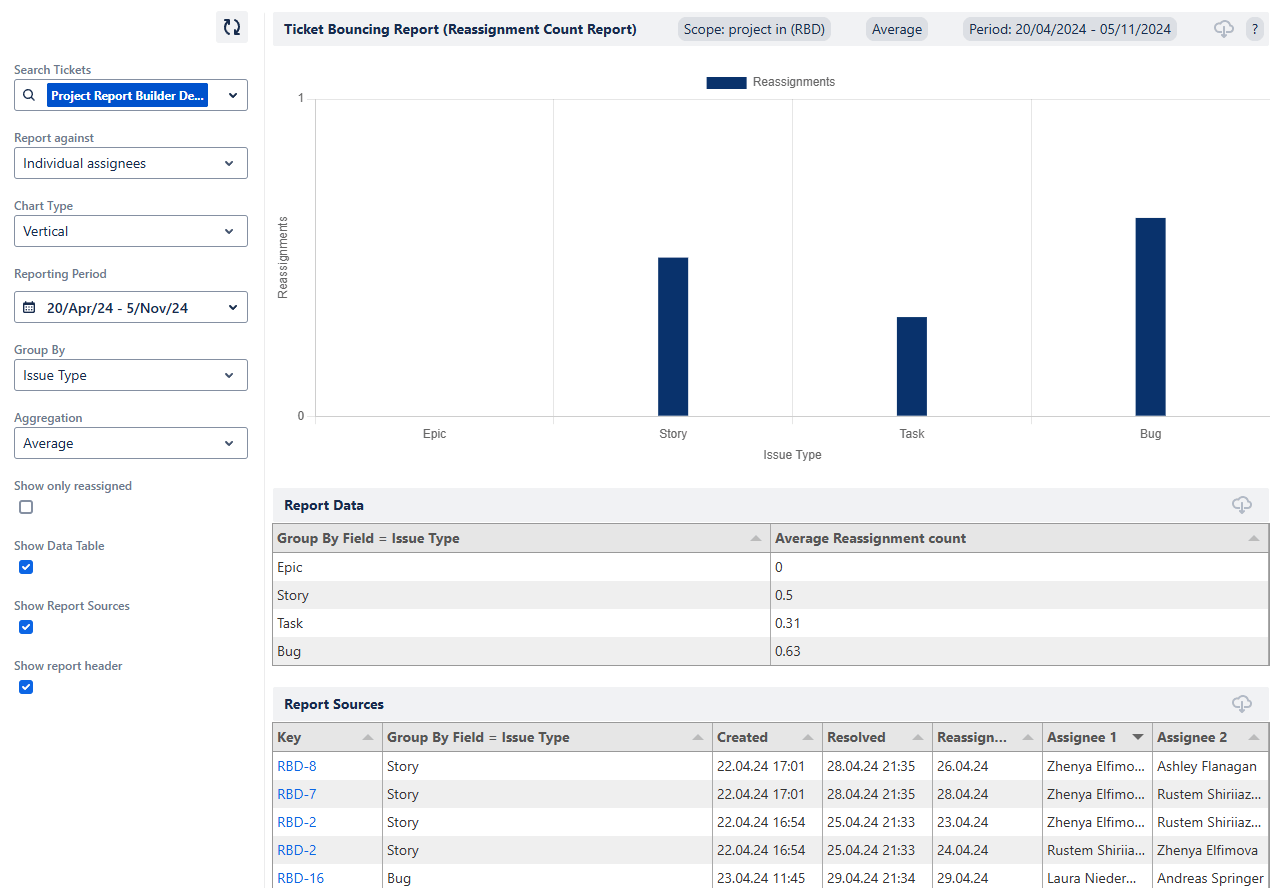
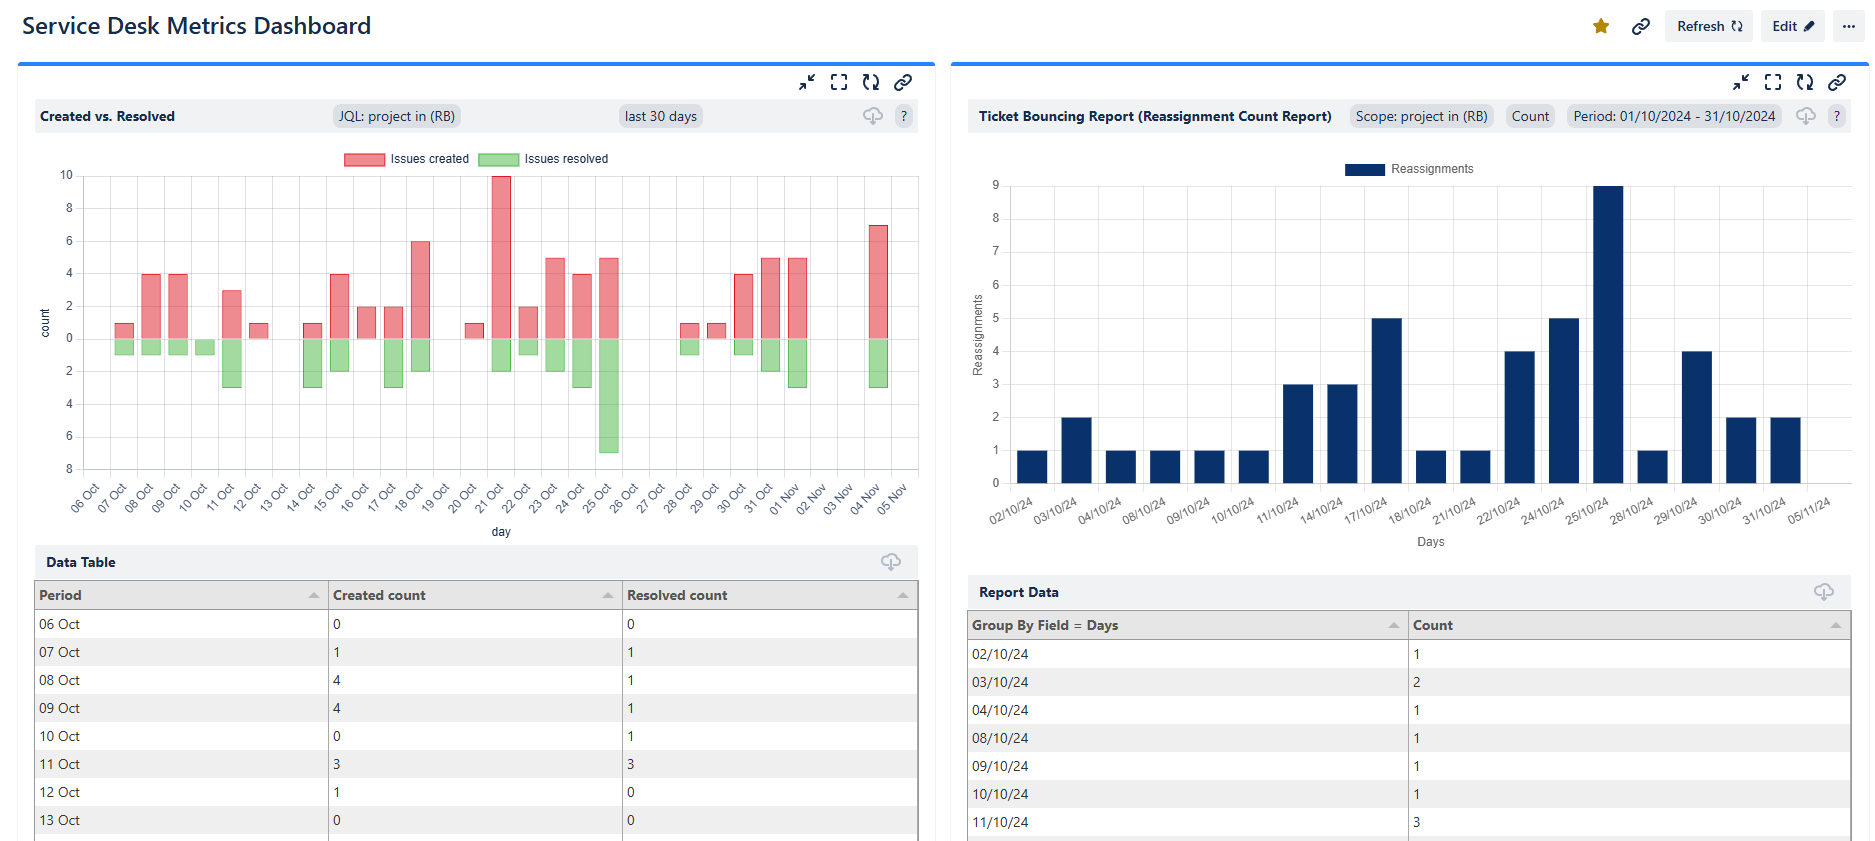
In our example, we’re using Report Builder’s ticket bouncing report, which analyzes how often a case is referred to other support agents. This allows you to identify where training, restructuring, or process optimization is needed. Here’s a detailed explanation of the ticket bouncing report’s benefits.
A great advantage of all Report Builder reports is that you have numerous filter options. You can select several projects at the same time and significantly expand your project management overview. And you can also filter by epic and specific issues or define your own filters. If you like to work with JQL, you can also simply describe all filters in a JQL query.
Define which time period you want to evaluate and how the reassignments should be measured: as average, number, median, minimum, or maximum.
This is what your reports could look like:
Vertical diagram, grouped by days
Vertical diagram, grouped by issue type
Horizontal chart, grouped by projects
Horizontal chart, grouped by priority
You can also show report sources, i.e. all tickets involved in reassignments are displayed, including the summary, additional data, and links to the issues. This is an excellent overview to understand when a ticket was created and resolved and who was the first assignee.
ℹ️ Find more information about Report Builder’s ticket bouncing report in our documentation.
Step 3: Save the report template
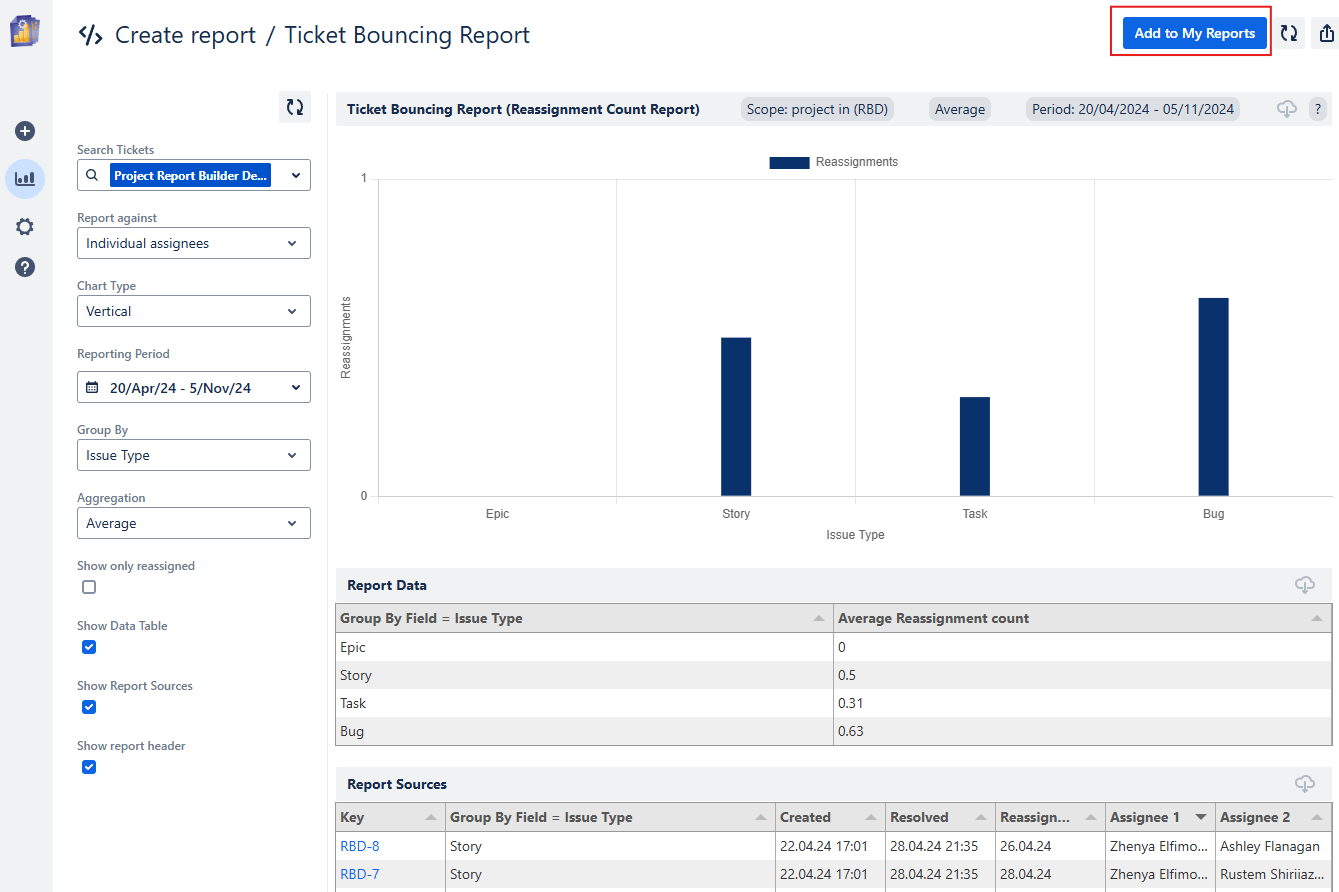
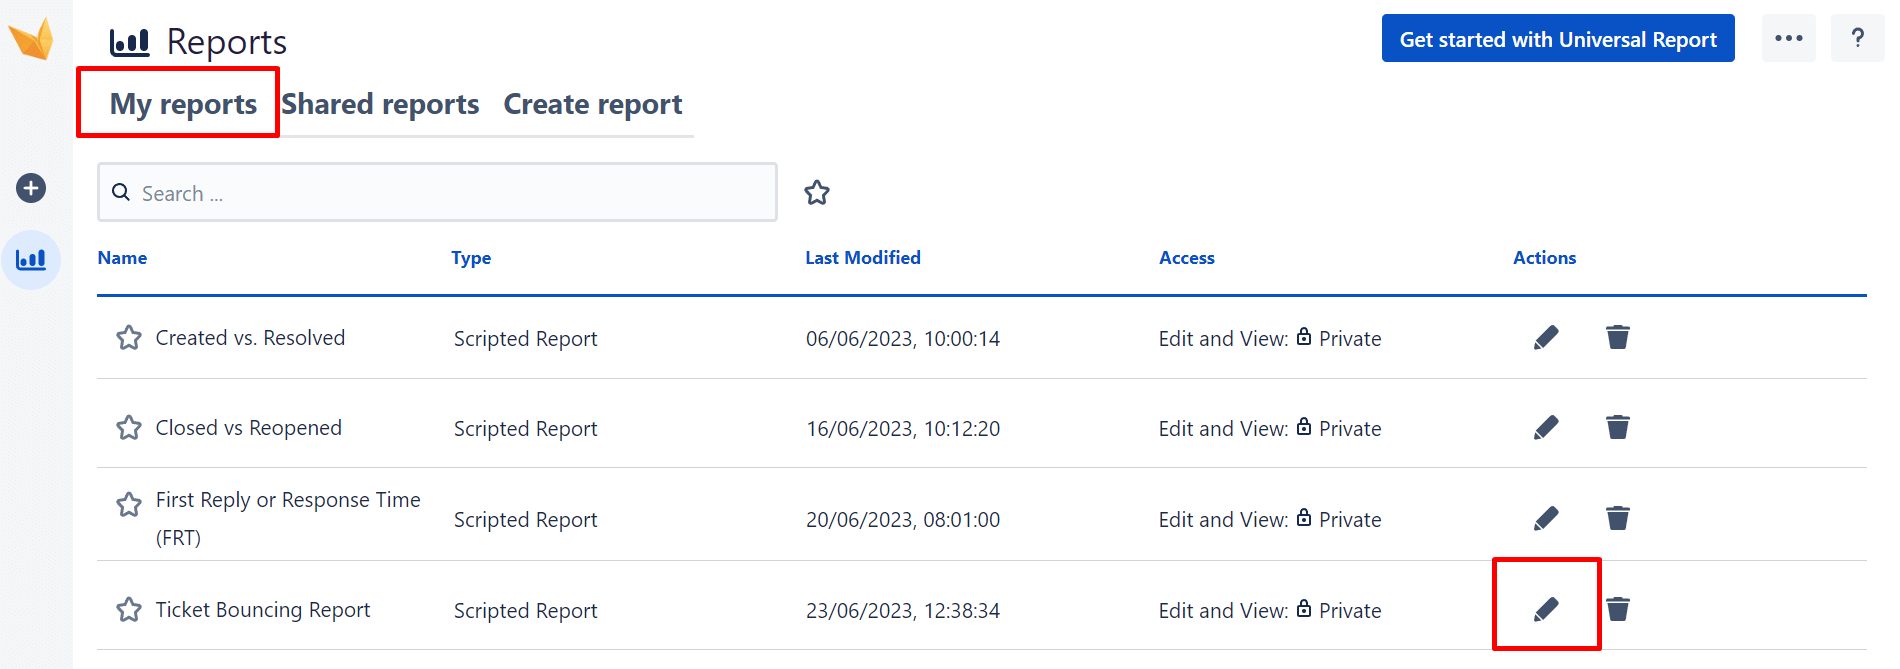
Once you are happy with the look and filtering of your report, click Add to my reports and the report will be added to your personal list of reports.
Now let’s look at the real power of the reporting templates by clicking on the pencil icon for further editing.
Step 4: Adjust your custom report using HTML or JavaScript
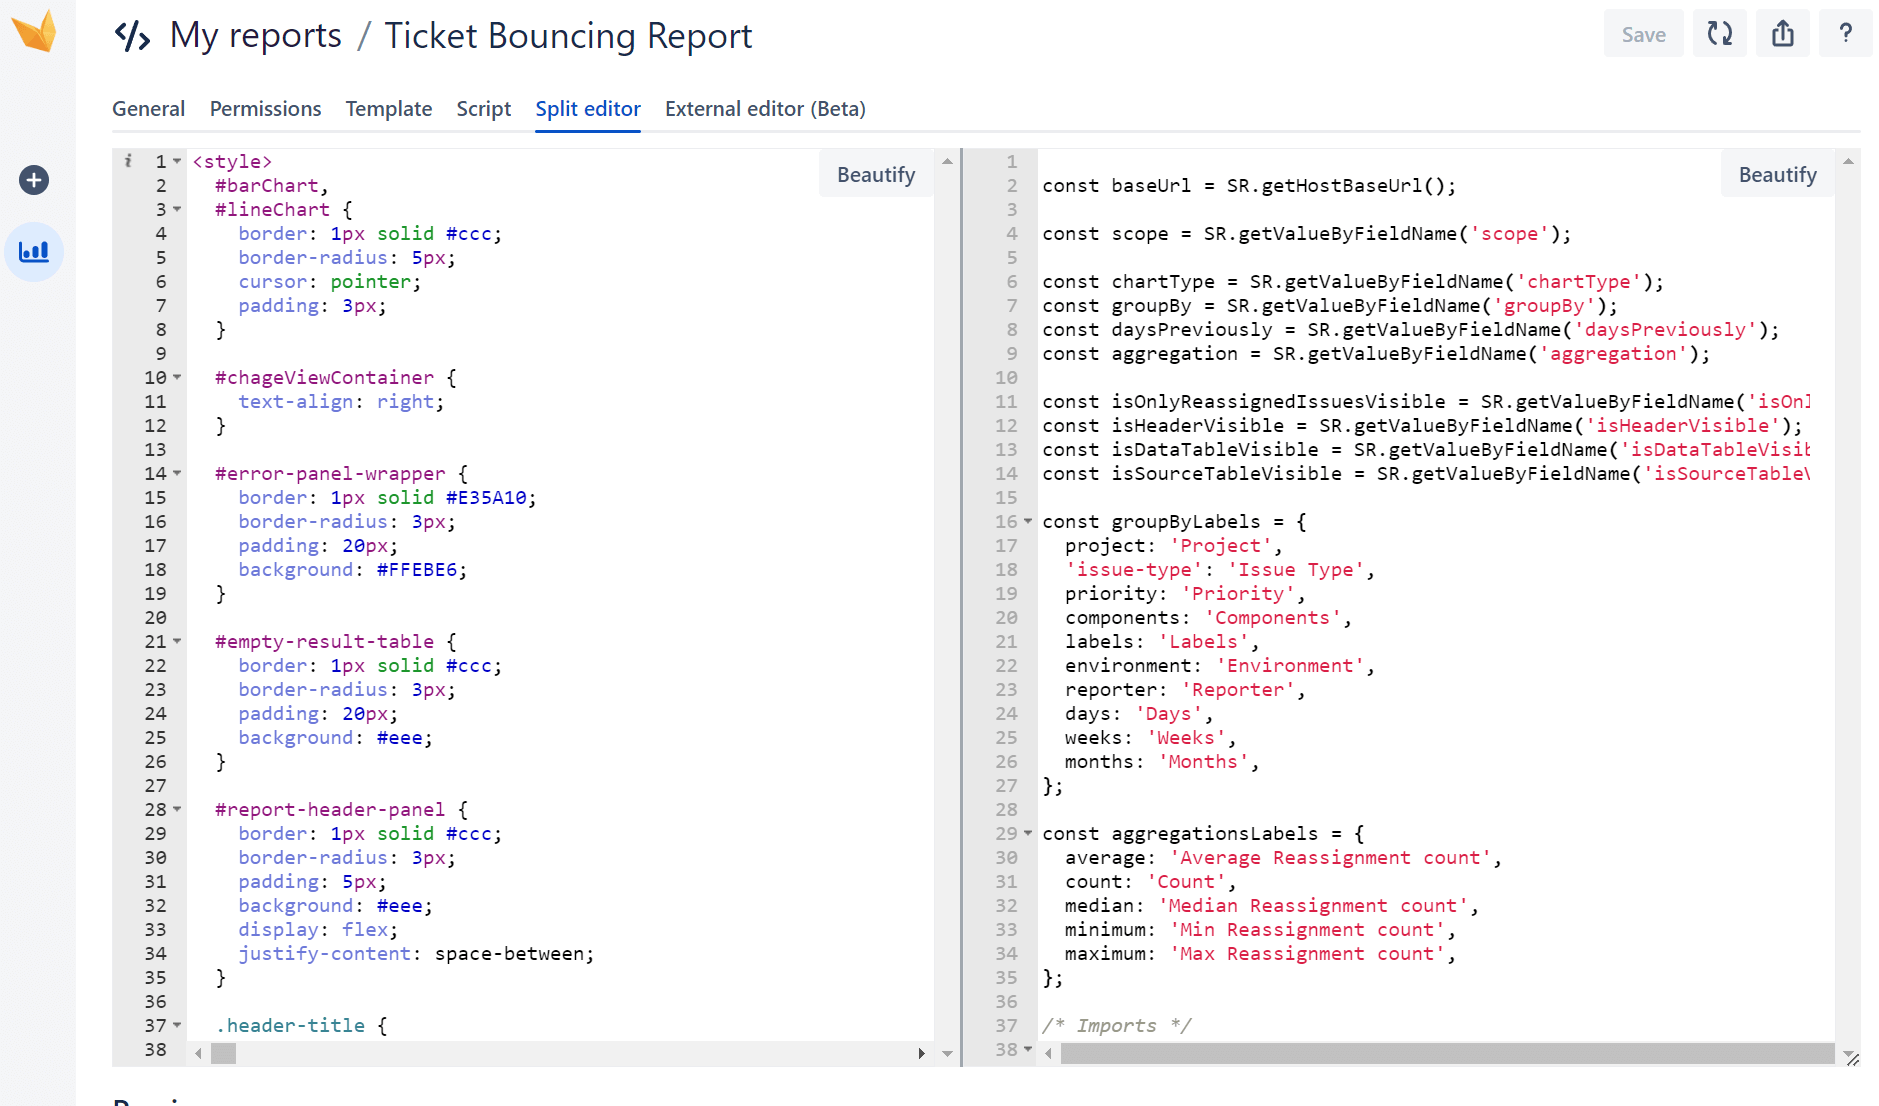
Once in edit mode, you can extensively customize permission schemes, ownership and editing access, as well as edit the report’s template using HTML. The behavior for retrieving and passing data can also be easily handled by working with JavaScript. In the Split Editor, you edit the template and script on one screen.
And if you prefer to use your own environment like Visual Studio Code or another IDE, you can do that too.
ℹ️ Find out more about creating scripted reports.
Step 5: Export the report
You can export the entire report as PDF, JSON, PNG, print or CSV. All the details are in this export guide.
Step 6: Add the report to your Jira dashboard
All Report Builder reports can be created directly in your Jira dashboard or imported there via a gadget. Here is our Jira reporting dashboard gadget guide.
Method 2: Code your own Jira custom report from scratch
What makes Report Builder as powerful as any BI tool is its scripting capabilities, which enable you to build any report from scratch right there in the Report Builder editor (or your own IDE). The key advantages over BI tools is that you can do this using JavaScript and HTML rather than a lesser-known or obscure data analysis language, and that you can build reports directly in Jira.
Here’s a step-by-step guide to creating Jira custom reports using Report Builder’s scripted reports feature.
Step 1: Navigate to the editor
As with method 1, navigate to the start screen of Report Builder by clicking on Apps > Report Builder.
Now click the … in the top menu, which lets you:
-
Import an already created report from JSON
-
Create your own custom Jira report directly in Report Builder
Click on New Scripted Report.
Step 2: Create your report
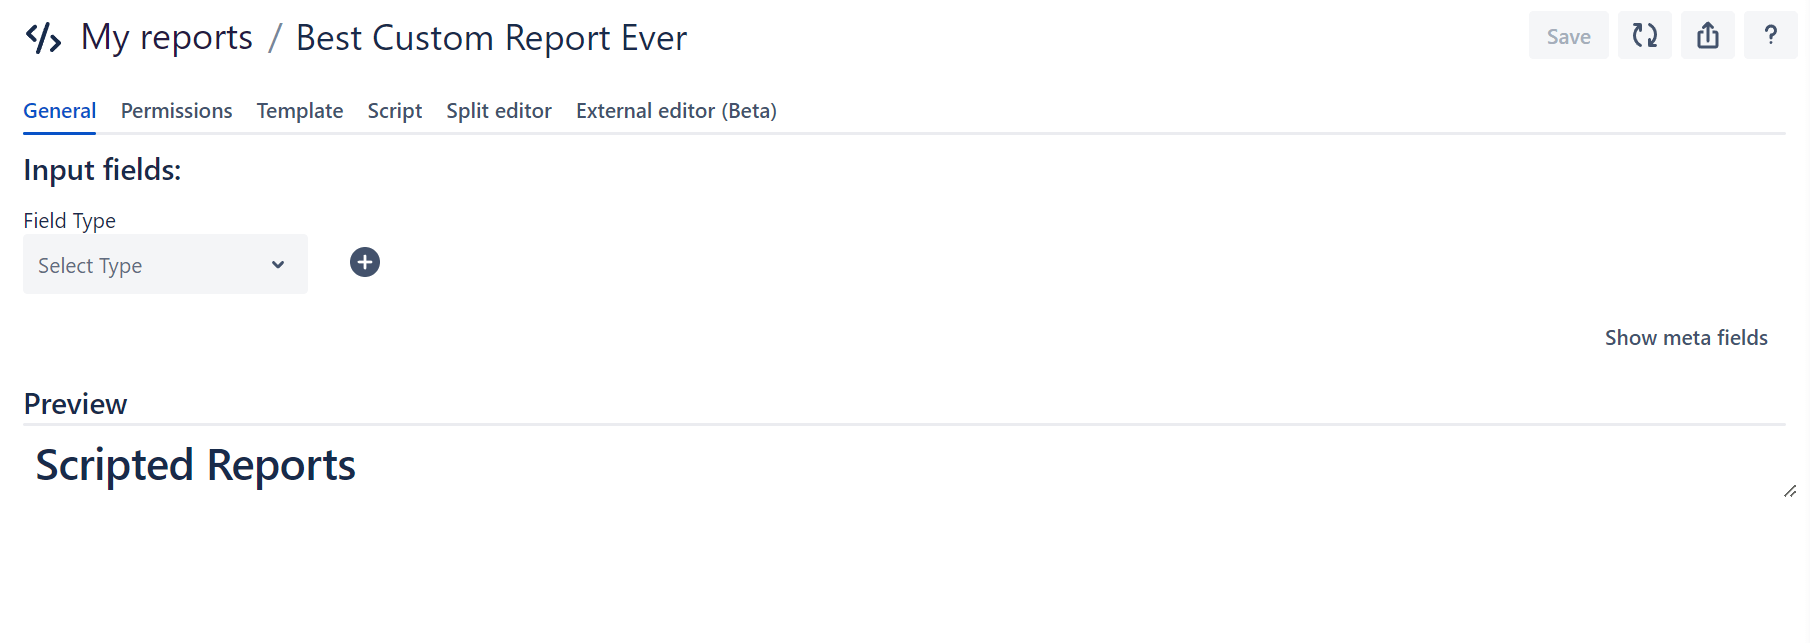
You will see a white interface and will have to enter a title for your report, then hit Add to My Reports.
The report will be saved as a blank template and added to your reports.
Step 3: Edit your report
Once saved, you will immediately be taken to edit mode. Clicking on the pencil icon will show you the view already described from several tabs for the editing options.
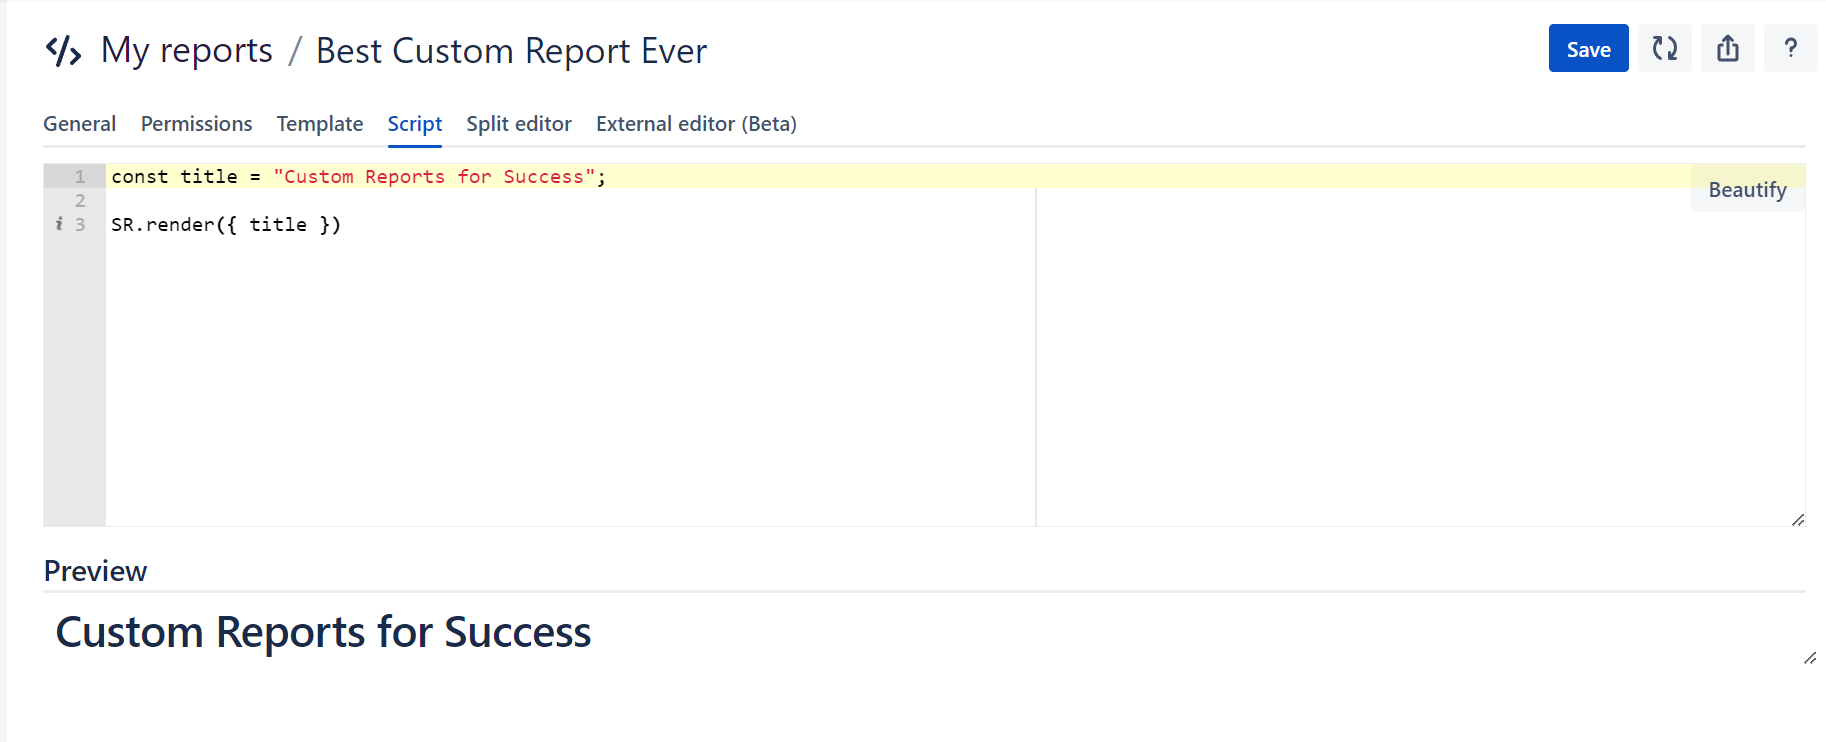
There’s no limit to what you can do here. You are completely free to create your own Jira custom report with JavaScript and HTML coding. The preview directly below the editor allows you to test the visualization of the newly entered code directly.
If you have linked an external IDE, you can also enable report hot re-render, which will give you the same fast preview.
In our documentation, you will find useful code snippets that can serve as inspiration.
Don’t forget to save!
Step 4: Export the report
As with method 1, you can export the report as PDF, JSON, PNG, print or CSV. You can find all the details in our export guide.
Step 5: Add the report to your Jira dashboard
Discover how to add your custom report to your Jira dashboard in our dashboard gadget guide.
Method 3: Actonic’s report building service
If you don’t have the time, skills, or resources to customize Report Builder’s templates or code your own report from scratch, then you could consider using Actonic’s report building service. Our experts will create a custom Jira report for your specific use case while you focus on your core business.
We have done this for numerous companies, like chemical company BÜFA. Their app team (like so many others) were struggling to do all their reporting in Excel, with static tables that couldn’t adequately map or improve processes. They came across our report building service and, following a detailed requirements analysis, we built a custom Jira report that enabled them to increase their delivery targets dramatically in a short time.
“Truly outstanding. This report updates itself. We were able to throw the Excel spreadsheet overboard and all of our colleagues are happy.”
Kristof Männel
Team Lead Application Technology, BÜFA
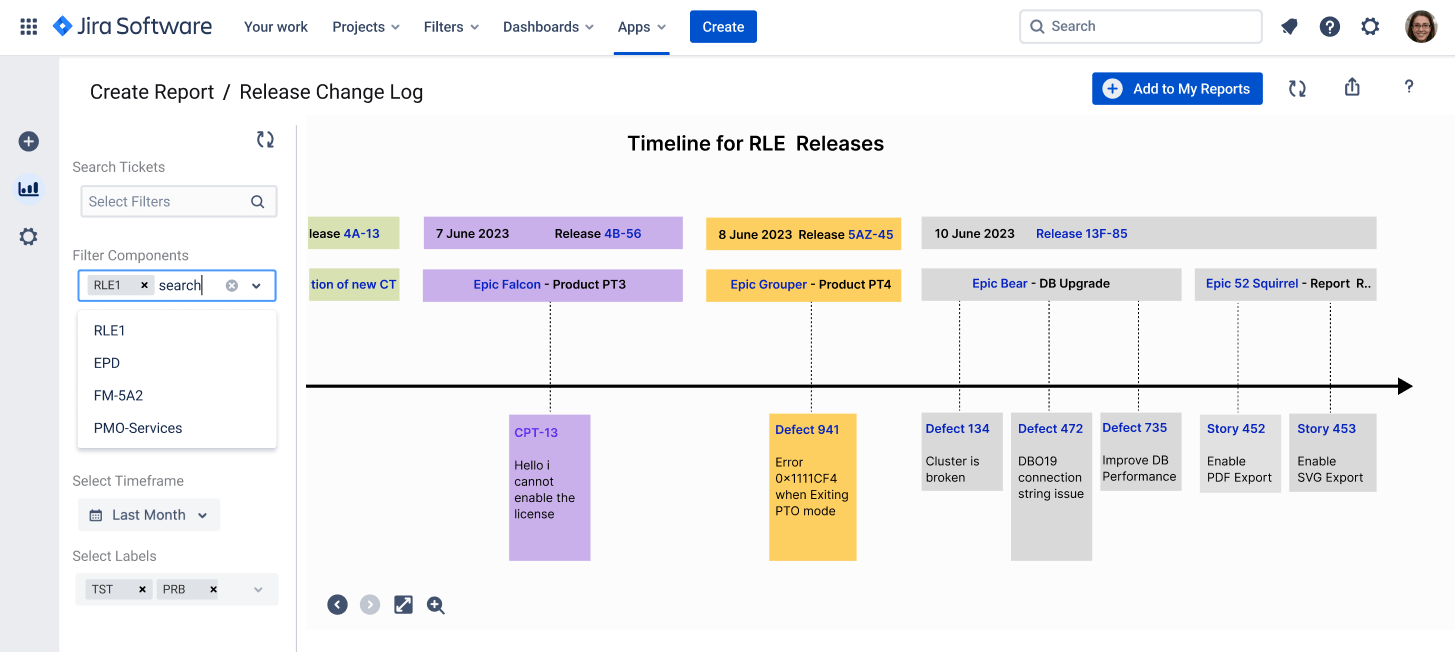
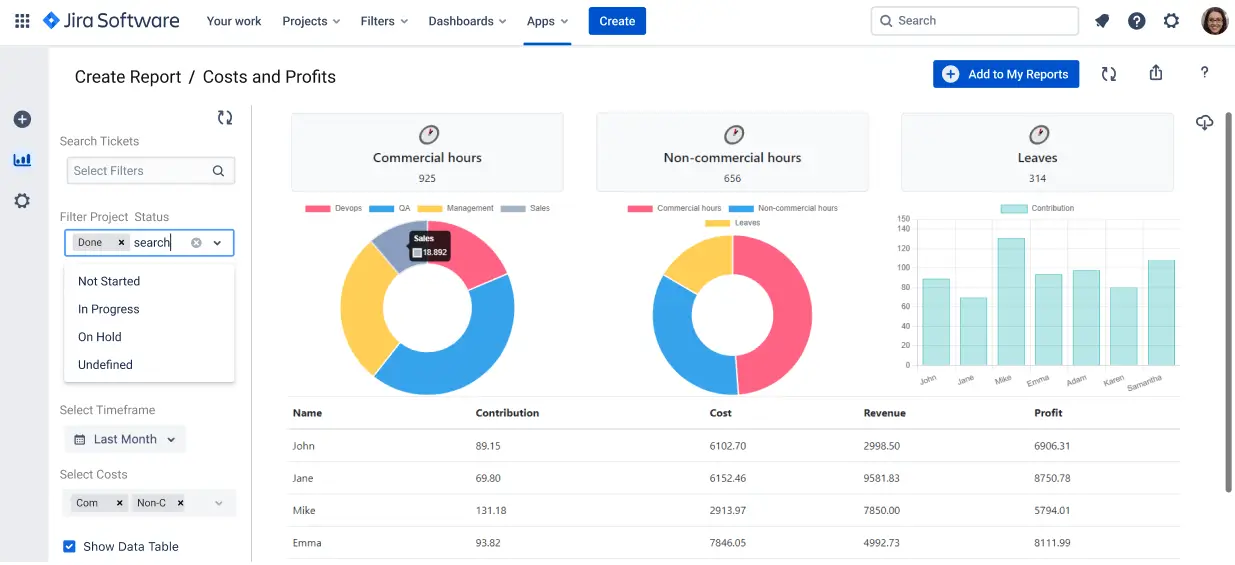
Here’s what your custom reports could look like:
Release timeline
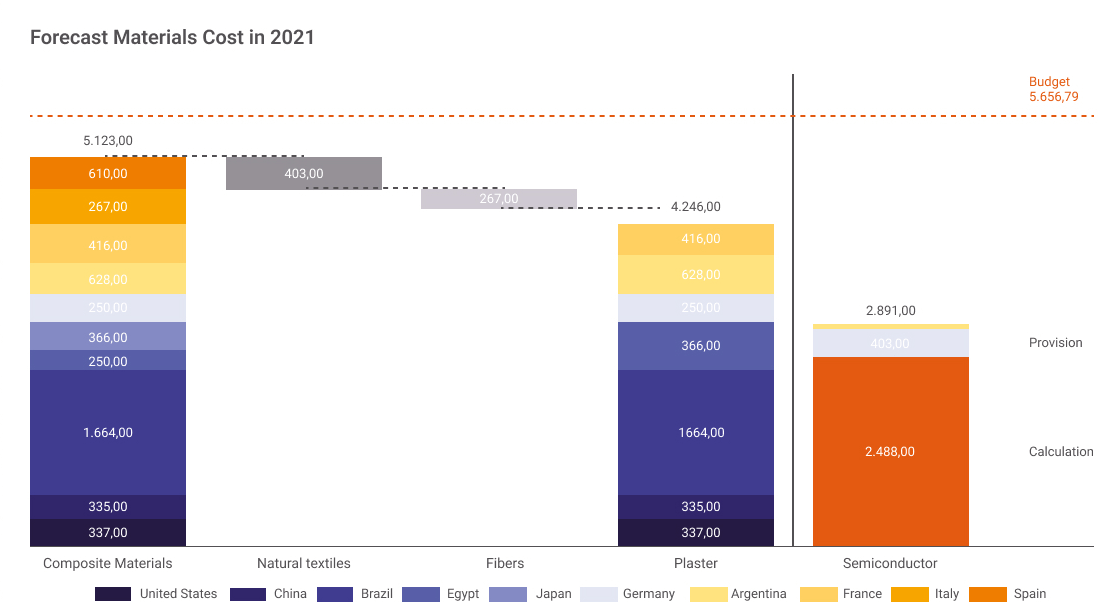
You can read the full BÜFA success story for more context. Alternatively, read a success story about a customer dealing with cost calculations.
Contact Actonic’s report building service
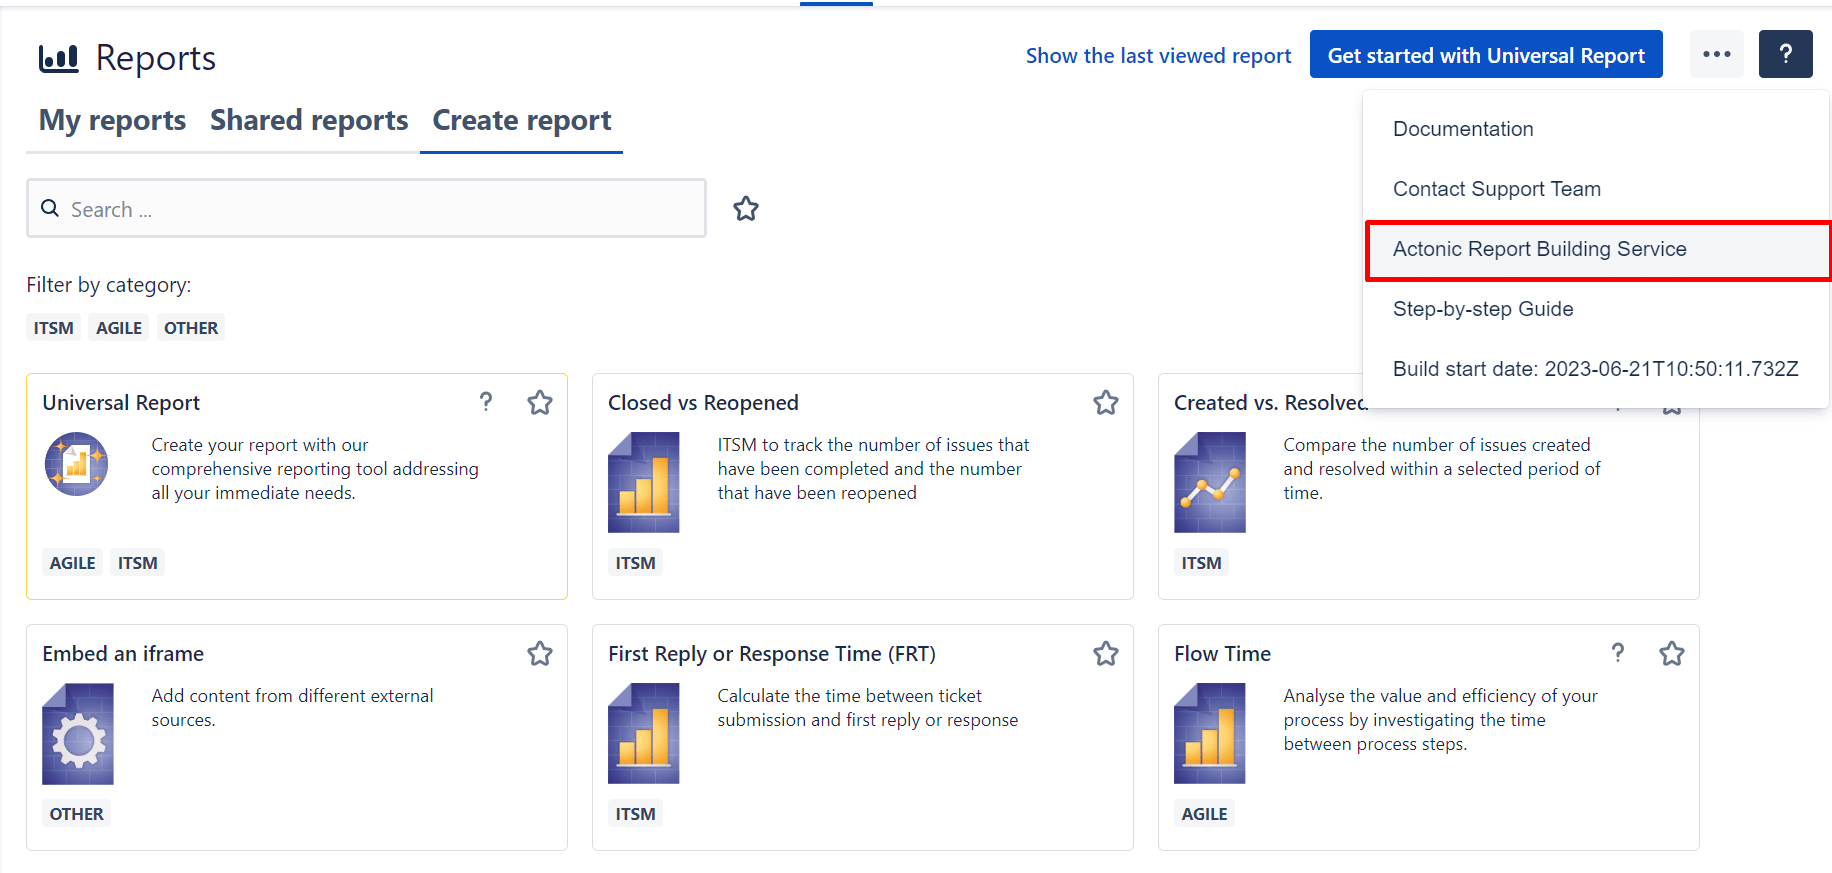
To contact our coding specialists, simply click on the question mark in Report Builder and then on Actonic Report Building Service.
You will be redirected to our support team where you can submit your scripted report request.
To summarize (TL;DR)
-
Custom reporting in native Jira is limited. Most are default reports that show a predetermined metric. There are a few where you can decide what data is shown, such as the pie chart and single-level group by. And 2D filter statistics is the only multidimensional report you can make (max two dimensions). However, none of these come with display customizability.
-
In Jira Service Management, you can make multidimensional custom JSM reports with more than two data series. However, one of the dimensions must always be time and time will always be the x-axis variable. So you can’t, for example, see the number of open issues per customer, grouped by priority, with customers along the x-axis.
-
Other drawbacks of JSM custom reports are the basic display customizability (line charts only) and the fact that each of the series on your charts has to be manually configured.
-
Many companies turn to business intelligence (BI) tools because of the limitations of native Jira custom reports. However, BI tools require developers and admins to learn new development languages and implement a process for extracting, processing, and organizing data. This is overkill.
-
Technical people who want to create Jira custom reports just want to be able to select the data they want to report on and start building. This is why an app like Report Builder for Jira is often a better fit than a full-scale BI tool. Reports are created using JavaScript and HTML, which are languages most technical experts already know, and there’s no need for any data processing.
-
Although it’s quicker and easier to build unique custom reports with Report Builder because of the dramatically reduced learning, it’s just as powerful as apps like EazyBI and PowerBI. Like those tools, customizability in Report Builder is limited only by the user’s imagination.
- There are three ways of building custom Jira reports with Report Builder:
-
customize the app’s built-in report templates for agile and ITSM using JavaScript and HTML
-
code a report from scratch using JavaScript and HTML
-
use Actonic’s Jira report building service
-
If you want to starting building custom Jira reports in Jira without the learning, setup, and maintenance that goes with BI tools, try Report Builder free for a month or book a personal demo.
