Jira reports by just asking: the Report Builder assistant in Rovo
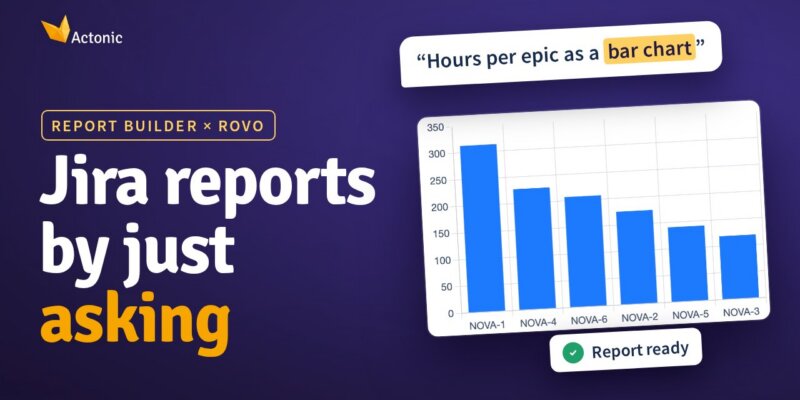
You know the report you need: hours per epic, open bugs by priority, what the team finished last sprint. What slows you down is the setup. Which field holds the epic? Which grouping, which filter, which chart?
Report Builder now has its own AI assistant in Rovo. You describe the report in plain words, and the assistant builds it on live Jira data. Nothing is created until you review the plan and confirm it.
This article walks through both kinds of reports the assistant builds, with the exact requests we used.
Watch it in 2½ minutes
The video shows one request turning into a bar chart, a follow-up change made by chatting, and a scripted report with KPI tiles. The steps below follow the same order.
Two kinds of reports, one conversation
The assistant builds two kinds of reports. Both open in Report Builder and run on live Jira data.
| Universal Visual Builder report | Scripted report | |
|---|---|---|
| What you get | Bar, pie and doughnut charts, pivot tables, simple tables and single numbers, built from your Jira fields | A page with its own code: KPI tiles, custom layouts, any chart |
| Best for | Questions a standard chart or table answers | A one-page summary or a layout no pivot can produce |
| Changing it later | Like any Universal Visual Builder report: switch the chart, rearrange fields, add new ones | Users change the settings the script exposes as inputs. Adding inputs or changing the code needs the Scripted Reports Creator permission |
Start with a Universal Visual Builder report. Ask for a scripted report when a standard chart does not answer the question.
From question to chart in five steps
1. Open the assistant. In Report Builder, click AI in the header, next to the logo. The Rovo panel opens on the right with the Report Builder Assistant.
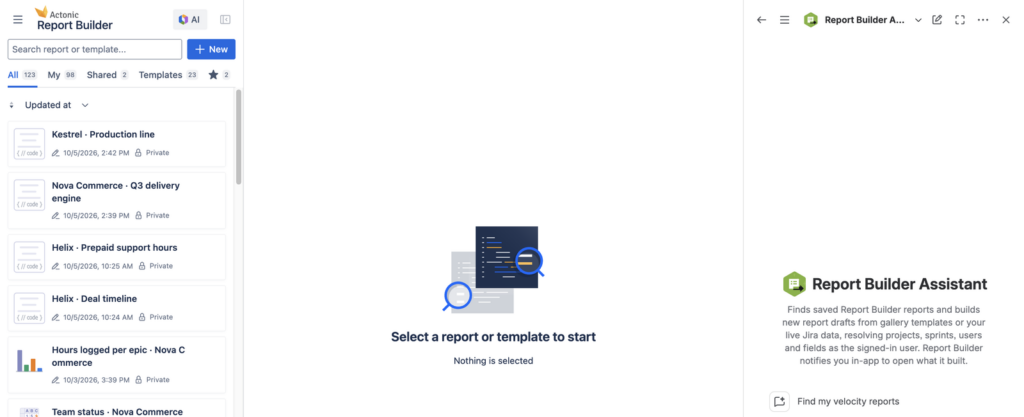
2. Say what you need. Type the request in plain words and press Enter:
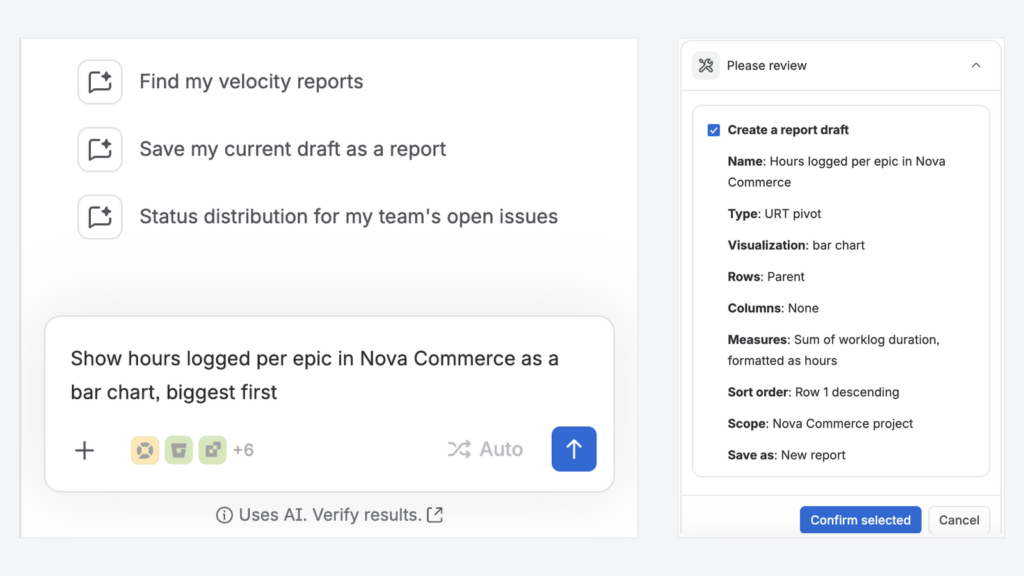
Show hours logged per epic in Nova Commerce as a bar chart, biggest first
3. Check the plan. Before anything is created, a Please review card shows the plan: name, visualization, rows and columns, measures, sort order and scope. If it is right, click Confirm selected. If not, cancel and rephrase.
4. Open the report. A Your report is ready notification appears. Click Open: the chart and its numbers, calculated on live Jira data.
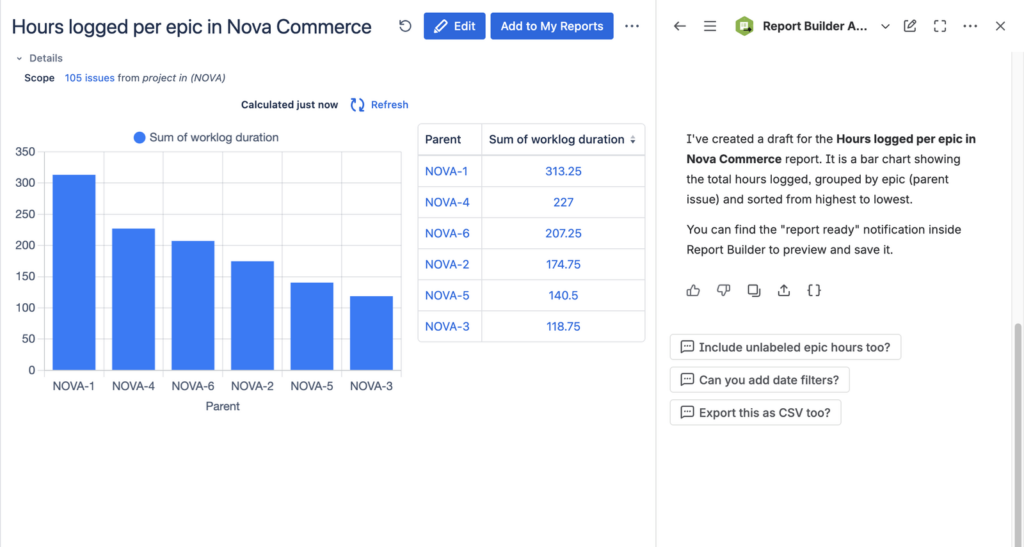
5. Adjust it by chatting. Reply in the same conversation:
Show it in days instead of hours
The change goes through the same review card. A different chart, another grouping, a date filter or a new sort order work the same way.
Save it. The report is a draft until you click Add to My Reports. Drafts expire after 24 hours. A saved report is an ordinary Report Builder report: share it, export it or put it on a Jira dashboard.
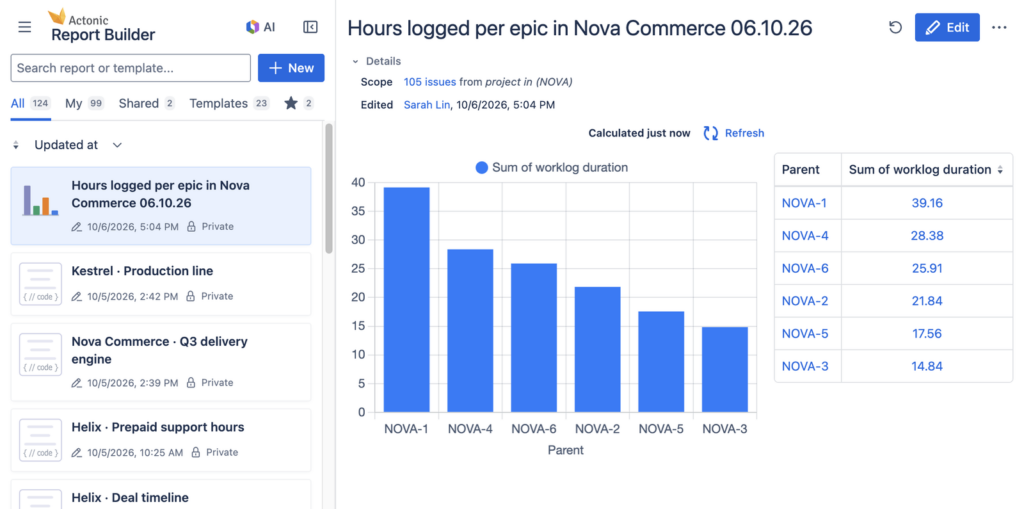
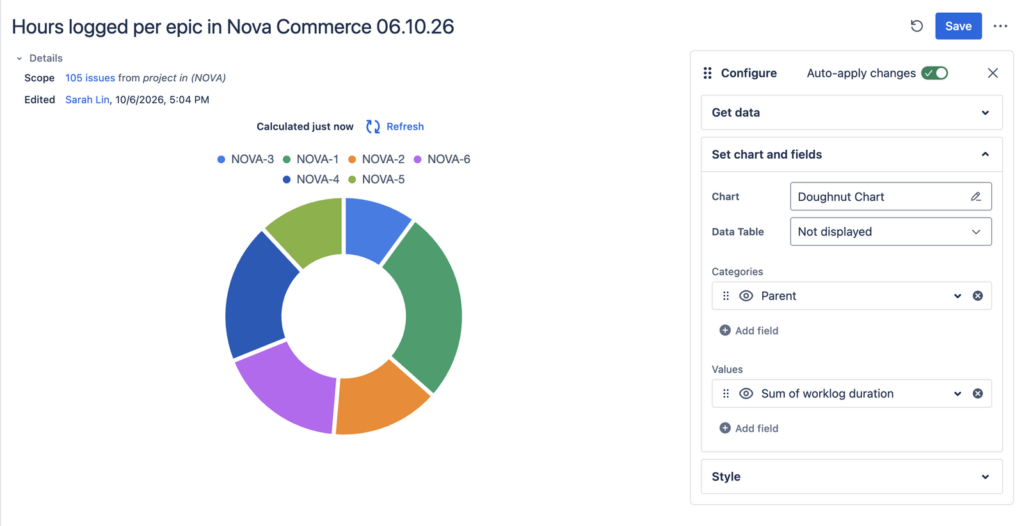
Edit it like any report. Click Edit, switch the chart type in Set chart and fields, drag fields to rearrange them or add new ones. You can also keep asking the assistant: it changes the report you have open instead of making a copy.
When a chart is not enough: scripted reports
Some questions need a page, not a chart. Ask the same way and say you want a scripted report:
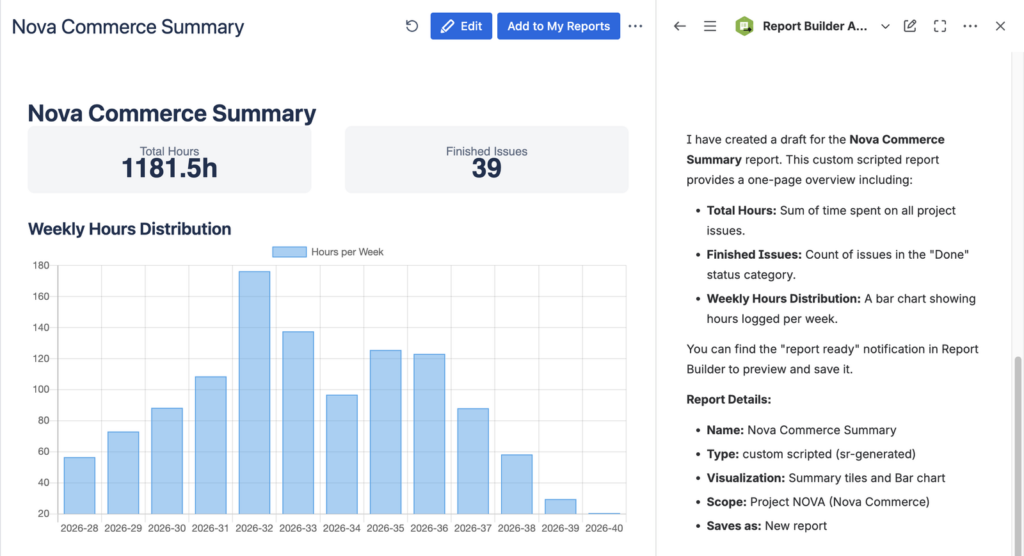
Build a custom scripted report for Nova Commerce: a one-page summary with total hours, finished issues and a weekly hours chart
The assistant writes the code. The review card shows the name, a summary, the project and the script; you only need to check the summary and confirm. The result is the page you described: KPI tiles and a weekly chart.
Scripted reports are edited differently:
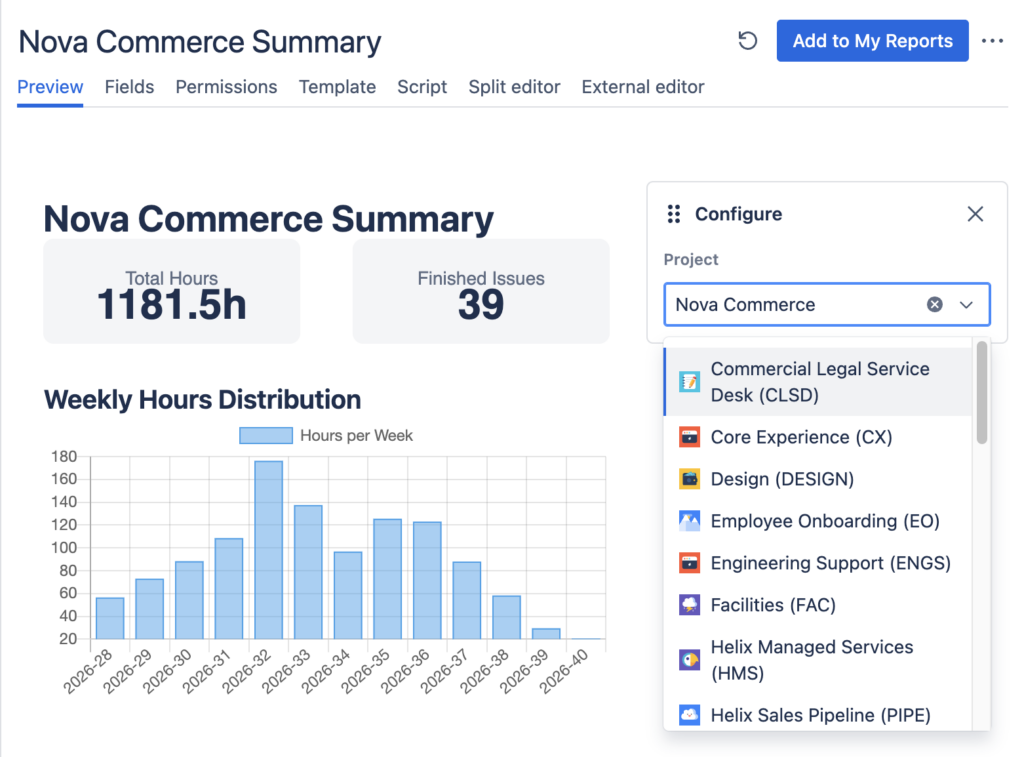
- Users change the inputs. In Edit, the panel shows only the settings the script exposes, such as Project. Pick another project and the page recalculates.
- Creators change the report itself. Add inputs on the Fields tab or edit the code on the Script tab, by hand or by asking the assistant. Both need the Scripted Reports Creator permission, granted by a Jira administrator.
Tips for a better first draft
A good request answers three questions:
| Say | Example | It becomes |
|---|---|---|
| The project | “in Nova Commerce” | The scope: which issues are read |
| The number and how to split it | “hours logged per epic”, “open bugs by priority” | The measure and the grouping |
| The period and the chart | “last quarter, as a bar chart, biggest first” | The date filter, the visualization and the sort order |
Numbers look too low? Check the Scope line on the review card. Worklogs often sit on sub-tasks: in Edit → Get data, turn on Include child issues.
Who sees what. The assistant works as you and sees only what your Jira account can see, so two people can get different numbers for the same question. Report Builder stores no data outside Atlassian. Rovo marks its answers with Uses AI. Verify results., so check the scope before you share a report.
Try it
Open Report Builder, click AI and ask for the report you have been putting off.
- New to Report Builder? Get it on the Atlassian Marketplace.
- Step-by-step guide: Build reports with the Report Builder assistant in Rovo.
- Working in Claude, Cursor or Codex instead of Jira? Read how to connect Report Builder to your AI client via MCP.
- Need a report the assistant cannot build yet? We build custom reports for Report Builder customers for free, usually within one working day: request a custom report.

 Request