🚀 Report Builder 7.13 — 25+ new features and a major performance upgrade
Report Builder 7.13 is one of our biggest releases yet.
At the center of this release is a completely redesigned calculation engine that makes even complex reports dramatically faster while significantly reducing memory usage.
In our benchmark scenarios, Report Builder is now up to 3600× faster. A report that previously took around 70 minutes to calculate can now finish in approximately 1.2 seconds.
Large datasets are also much safer to work with. Memory consumption has been reduced by up to 90%, helping prevent browser crashes such as “Aw, Snap!” when working with particularly demanding reports.
But performance is only part of this release. Report Builder 7.13 also introduces new visualization capabilities, much more control over totals and subtotals, flexible sticky rows and columns, improved table layouts, richer drill-downs, nested subcharts, and many smaller usability improvements.
⚡ A completely redesigned calculation engine
The calculation engine behind Universal Visual Builder feature (Former Universal report) has been redesigned end-to-end.
The new engine is optimized for reports with large datasets, multiple nested dimensions, complex aggregations, and worklog-heavy configurations.
The result is a major improvement in both calculation speed and memory efficiency.
Benchmark results
We tested the new engine using a synthetic dataset containing:
- 10,000 issues
- 20 projects
- 12 authors
- 6 worklogs per issue
| Scenario | Before | Now | Improvement |
|---|---|---|---|
| Heavy nested report ~260 dimensions, complex nested configuration |
~70 minutes | ~1.2 seconds | 3603× faster |
| Report with one empty axis ~40 dimensions |
~32 seconds | ~0.7 seconds | 44× faster |
| Four-level nested report ~740 dimensions, four levels of grouping |
~6.2 minutes | ~4.7 seconds | 79× faster |
In the heavy nested scenario, memory usage also dropped from approximately 553 MB to 60 MB — an 89% reduction.
Across the benchmarked scenarios, calculation times improved by between 44× and 3603×, while memory usage in the most demanding scenarios was reduced by approximately 70–90%.
Actual performance improvements depend on the report configuration, dataset size, selected dimensions, measures, and filters.
📈 New charts and visualization capabilities
Report Builder 7.13 significantly expands the visualization options available in Universal Report.
New visualization picker
Choosing a visualization is now easier with a new visual picker.
Visualization types are presented as clear tiles with additional hints, making it easier to understand the available options and select the right visualization for your report.
Horizontal Pivot Table orientation
The Pivot Table can now be displayed using a horizontal orientation.
This gives you more flexibility when designing reports where the default layout does not fit the structure of your data or the available screen space.
Automatic project selection for Burnup and Burndown charts
Beta — Scripted Reports
The Burnup/Burndown chart can now automatically preselect the relevant project.
This reduces the amount of manual configuration required when opening or configuring the report.
Custom chart dimensions
You can now configure:
- chart height
- nested chart width
- nested chart height
This provides much more control over how visualizations fit into reports, dashboards, and different screen sizes.
Richer drill-down experience
Drill-down has been expanded with additional grouping capabilities and a richer user interface.
Drill-down data can now be grouped using information such as:
- worklogs
- change logs
This makes it easier to move from aggregated report values to the underlying activity that produced them.
Nested dimensions as measures
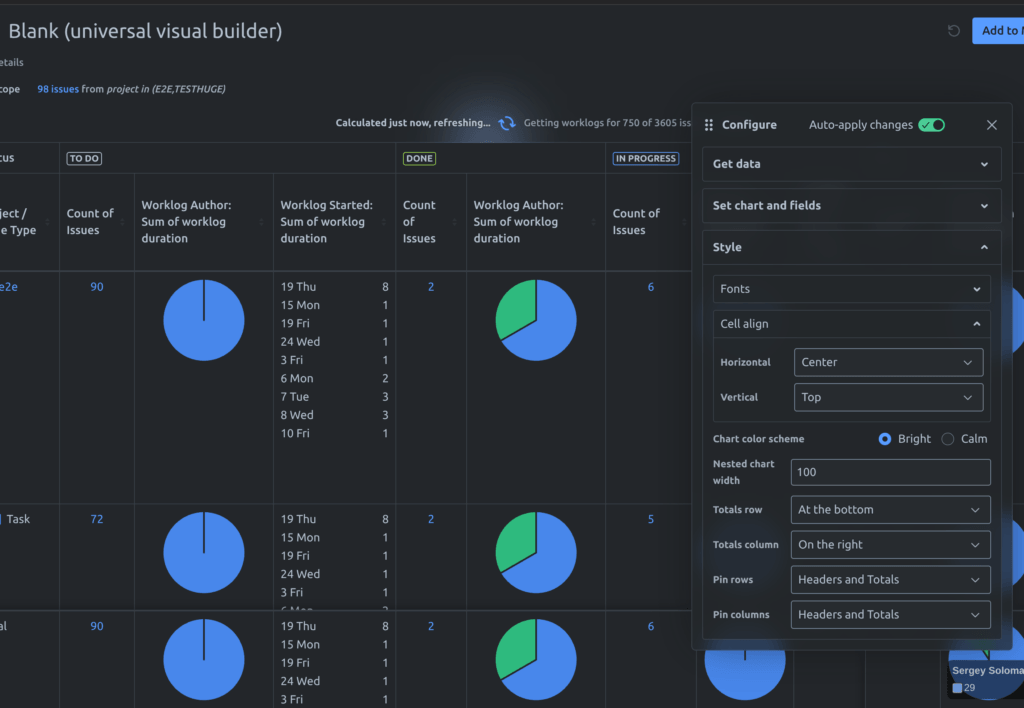
Nested dimensions can now be visualized as subcharts directly inside report cells.
This allows a single table to show both aggregated values and detailed visual breakdowns without requiring a separate chart.
For example, a report row can contain its main measure while also displaying a small chart showing how that value is distributed across another dimension.
Conditional formatting for nested subcharts
Conditional formatting can now also be applied to cells containing nested subcharts.
This makes it possible to combine visual breakdowns with existing formatting rules and highlight important values directly in the table.
Independent title positioning for subcharts
The position of titles can now be configured independently for different visualization types used as subcharts.
This gives you more control over the readability and visual consistency of reports containing multiple embedded chart types.
Improved hover animations
Nested pie, donut, and bar subcharts now have a smoother hover interaction.
When hovering over an element, surrounding data is subtly dimmed to make the selected value easier to identify.
Filter subchart data independently
Nested subchart data can now be filtered without changing the data displayed in the main table.
This makes it possible to use one dataset for the primary report structure while showing a more focused subset of the data inside a nested visualization.
🧠 Lower memory consumption for large reports
Performance improvements are not limited to calculation time.
The new engine also processes report data much more efficiently in memory.
For particularly large reports, this can mean the difference between a report opening successfully and the browser running out of available memory.
In our most demanding benchmark scenario, memory consumption dropped from approximately 553 MB → 60 MB. That is an 89% reduction.
This makes working with large Jira instances and data-heavy reports significantly more reliable.
⚡ Some reports can now open instantly
Report Builder 7.13 also introduces improvements to report caching.
When previously calculated data can be reused, some reports can now open immediately instead of requiring a complete recalculation.
This is especially noticeable when returning to reports that have already been loaded or when the underlying report data has not changed.
🛡️ Improved calculation correctness
The calculation engine redesign also gave us the opportunity to improve a number of complex aggregation scenarios.
This includes improvements to:
- empty-row filtering
- parent cell calculations
- total cell aggregation
- nested dimension calculations
- report configurations involving multiple aggregation levels
The result is not only faster calculations, but also more consistent results across complex report structures.
Σ More control over totals and subtotals
Release 7.13 adds much more granular control over how totals and subtotals are displayed in the Universal Report table.
Subtotal controls for individual dimensions
Subtotals can now be configured separately for each dimension.
Instead of using a single global subtotal configuration, you can decide exactly where subtotals should appear within a nested report structure.
This is particularly useful for reports with multiple grouping levels.
Hide the total row or total column
You can now hide the table’s:
- total row
- total column
This makes it easier to create cleaner report layouts when grand totals are not relevant to the analysis.
Measure totals when both axes are empty
When both report axes are empty, Universal Report can now display measure totals only.
This provides a simple way to use Universal Report for high-level KPI-style reporting without adding unnecessary grouping dimensions.
Count and Bar visualization in total rows
The Count and Bar rendering option is now supported in total rows.
This means totals can preserve the same visual representation used throughout the rest of the table instead of falling back to a plain numeric value.
Improved sticky totals
Sticky total rows and columns now have improved visual separation using shadows.
This makes it easier to distinguish fixed totals from the rest of the report while scrolling through large tables.
🧷 More flexible table layouts
Large Universal Report tables are now easier to navigate and customize.
Configurable sticky rows and columns
Rows and columns can now be pinned so that important information remains visible while scrolling.
This is particularly useful for reports with:
- many columns
- deeply nested dimensions
- long tables
- large numbers of measures
More control over table headers
Header visibility can now be configured separately for:
- row headers
- column headers
- measure headers
When headers are disabled, their containers automatically collapse where appropriate instead of leaving unnecessary empty space.
This makes it possible to create significantly cleaner and more compact report layouts.
Cell alignment controls
Horizontal and vertical cell alignment can now be configured directly from the Universal Report styles panel.
This gives you more control over the presentation of:
- text
- numbers
- measures
- headers
- table cells
🧩 Additional improvements
Clearer sidebar control
The control for showing and hiding the configuration sidebar has been made more visible.
This makes it easier to switch between report configuration and a larger report viewing area.
Open Report Permissions directly from the Report List
Report permissions can now be opened directly from the Report List.
You no longer need to open the report itself before accessing its permission settings, making report administration faster and more convenient.
🎉 And much more
Report Builder 7.13 combines one of our largest performance upgrades with a substantial expansion of Universal Report’s visualization and table customization capabilities.
The highlights include:
- Up to 3600× faster report calculations
- Up to 90% lower memory consumption
- Faster and more reliable handling of very large datasets
- Instant loading for some cached reports
- Nested dimensions visualized as subcharts
- More powerful drill-down capabilities
- Granular subtotal and total controls
- Configurable sticky rows and columns
- More flexible headers, alignment, and table layouts
- 25+ new features and improvements
This release creates a much stronger foundation for working with increasingly large and complex Jira datasets — while giving you more control over how the resulting reports look and behave.