Jira’s Version Workload Report is retiring — how to recreate it in Report Builder in 5 minutes
Atlassian is retiring Jira’s built-in Version Workload Report and — in Atlassian’s own words — replacing it “would require an additional solution”. Community answers suggest approximating it with saved filters and statistics gadgets, but none of those reproduce the report’s core view: remaining work in a release, broken down by person and work type.
In Report Builder this is a five-minute configuration, no template required.
What the Version Workload Report showed
For a selected fix version: the total remaining estimate of unresolved work, arranged as a matrix of users × work types, with per-user and per-work-type totals — the release manager’s “who still has how much of what” view.
Why burndowns and gadgets don't answer this question
Most of what Jira offers for tracking release progress answers a different question:
- The Release Burndown and Version Report project when the release will finish based on team velocity — they never show who carries the remaining work.
- Issue Statistics and Pie Chart gadgets grouped by assignee count issues in a
fixVersionfilter — they cannot sum the remaining estimate per person.
The Version Workload Report was the only native view of remaining work in a fix version by assignee — which is exactly what the matrix below rebuilds.
Recreate it as a Report Builder matrix
- Create a blank URT report — the default Matrix visualization is exactly what you need.
- Rows: Assignee. Columns: Issue Type.
- Measure: Sum of Remaining Estimate, “Pretty” format (“2d 4h”).
- Scope (JQL mode):
fixVersion = "1.5" AND resolution IS EMPTY.
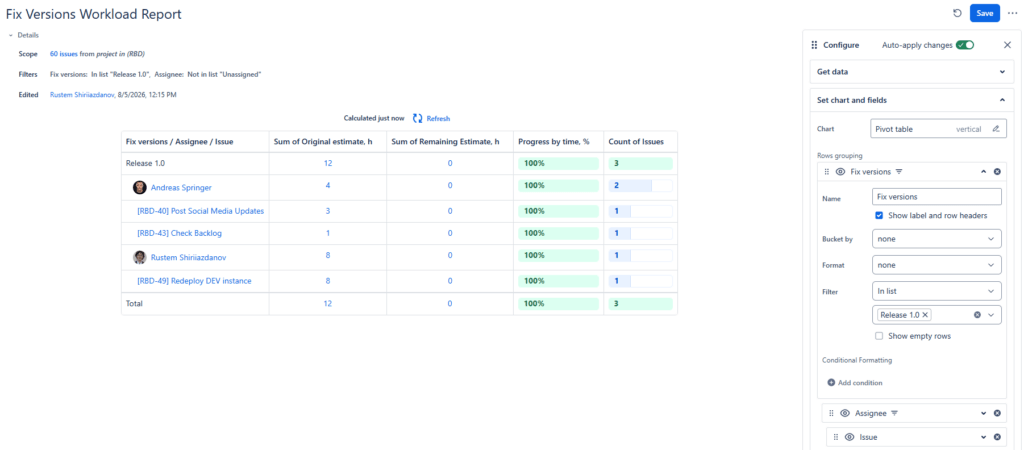
The matrix row and column totals reproduce the old report’s per-user and per-work-type roll-ups, and every cell drills down to the exact issues behind the number — either inside the report or straight into the Jira Issue Navigator.
Then go further than the old report could
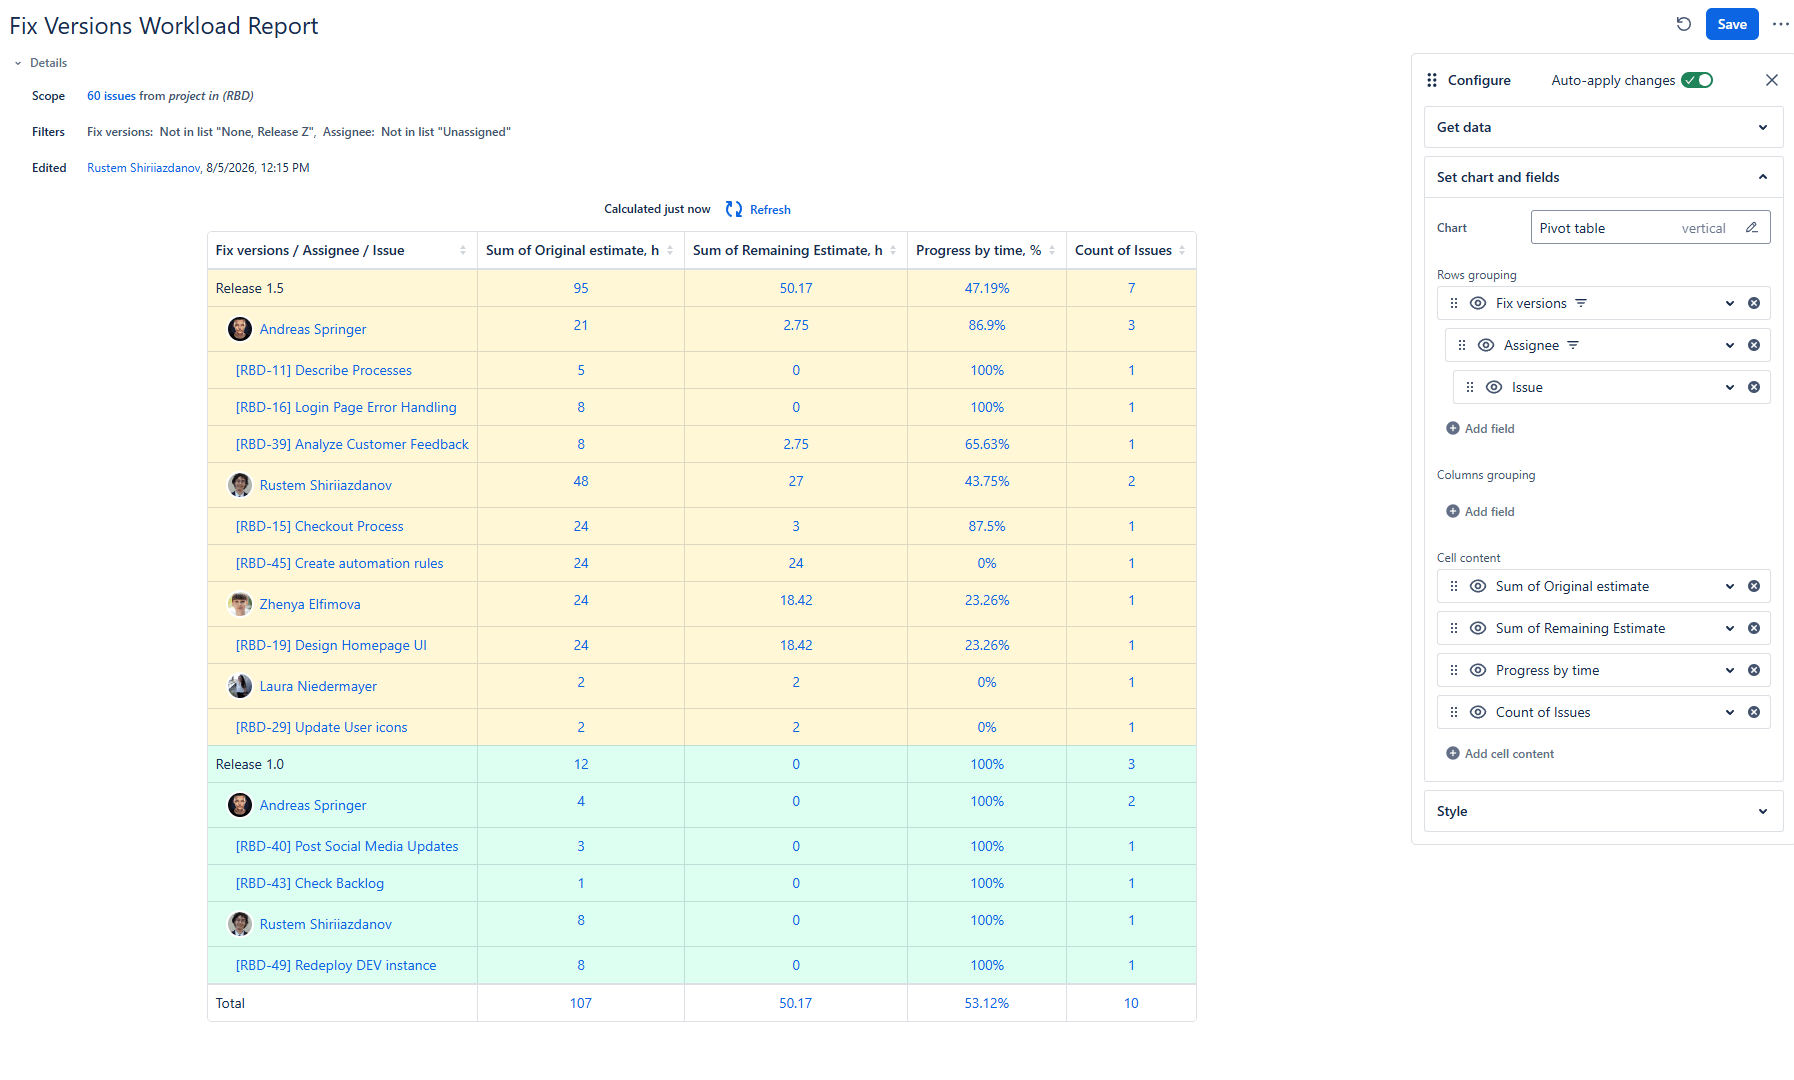
- All versions at once: add Fix Version as the first row dimension above Assignee and drop the version clause from the scope. One report tracks every open release; the retired report showed one version at a time.
- Progress, not just remaining: add Sum of Time Spent and a Progress by Time bar to see how far each person’s slice of the release has come.
- On the dashboard: save the report and add it to a Jira dashboard as a Report Builder gadget — the old report never left its project page.
- Different slices: swap Issue Type for Priority, Component, or any other field — the matrix is fully configurable.
Why this beats the gadget workarounds: Issue Statistics and Pie Chart gadgets count issues; they cannot sum remaining estimates per assignee. This matrix shows real time values, with totals, drill-down and a dashboard presence — the three things the community threads about this retirement keep asking for.
Frequently asked
Can’t I just use the Release Burndown? It answers “when will we finish” (velocity projection across sprints), not “who still has how much work”. The two views complement each other; only this one shows per-person remaining estimates.
Do sub-tasks count? Enable the “fetch child issues” scope option to include them; Jira’s Σ aggregate time fields are also available if you prefer parent-level roll-ups.
Can I filter to one team? Yes — extend the JQL scope, or add a filter directly on the Assignee dimension.
Does it work for unestimated issues? Issues without a remaining estimate contribute nothing to the sums; add a Count of Issues measure alongside to spot unestimated work hiding in a cell.

 Request