Australian financial year in Jira: tickets per quarter from 1 July to 30 June
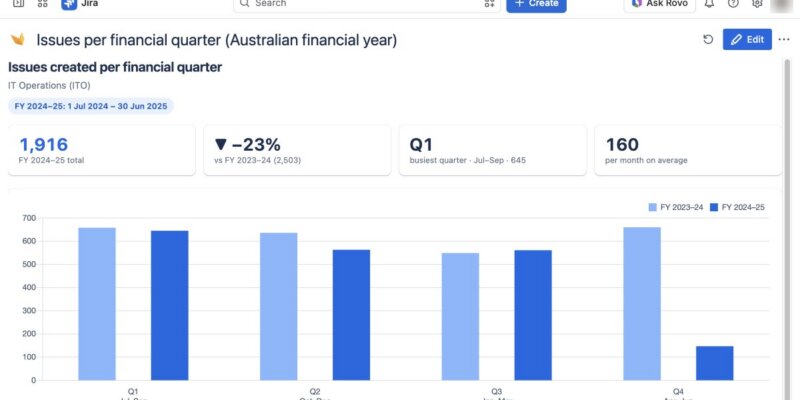
The same question comes up again and again in different forms. A service desk lead in Australia wants one bar chart on a Jira dashboard: customer requests per quarter of the Australian financial year, 1 July 2026 to 30 June 2027. What she gets from the built-in gadget is a rolling “last 365 days” window, with five partial calendar quarters on the x-axis instead of four financial ones.
The honest answer is that Jira can’t do it natively. This post shows why, what the usual workarounds cost, and a Report Builder report that solves it for any financial year, with the full source code at the end.
Why Jira dashboards can’t show financial quarters
Three things get in the way, and none of them is a setting you missed.
- Gadgets use calendar quarters. The “Quarterly” period in gadgets such as Created vs Resolved means January–March, April–June and so on. The other choice, “days previously”, is a rolling window that can’t be anchored to 1 July.
- JQL has no quarter functions. Jira Cloud has
startOfYear(),startOfMonth()andstartOfWeek(), andstartOfYear("+6M")does give you 1 July. But there is nostartOfQuarter(), and a request to add one is still gathering interest. - The financial year setting lives elsewhere. Jira Premium lets you change the financial year in Plans, and Jira Product Discovery has its own fiscal year setting. Both shape roadmap timelines, not dashboard charts.
If your company has Atlassian Analytics, a custom SQL date bucket can group by financial year. Most Jira teams don’t, and it still needs SQL.
The workarounds, and what they cost
The community answers suggest three native workarounds. They work, but each one needs ongoing care.
| Workaround | How it works | The catch |
| Labels from automation | A rule adds FYQ1–FYQ4 to each new ticket; an Issue Statistics gadget counts by label | Old tickets need a backfill, labels must be reset every year, and the labels clutter tickets |
| Four saved filters | One filter per financial quarter, one Filter Results gadget each | Four numbers, no bar chart; every filter needs new dates every year |
| Export to Google Sheets | A full-year filter pulled into Sheets with Jira Cloud for Sheets, charted there | The chart lives outside Jira and is only as fresh as the last refresh |
None of them compares this year with last year, and none tells you whether a half-finished quarter is ahead or behind.
The solution: a financial year report in Report Builder
Report Builder has a pivot builder for everyday reports, but its quarter grouping has no financial-year setting either. So we wrote a small scripted report: a report with its own code that runs inside Report Builder on live Jira data. You set the month your financial year starts in, and every chart and table follows it.
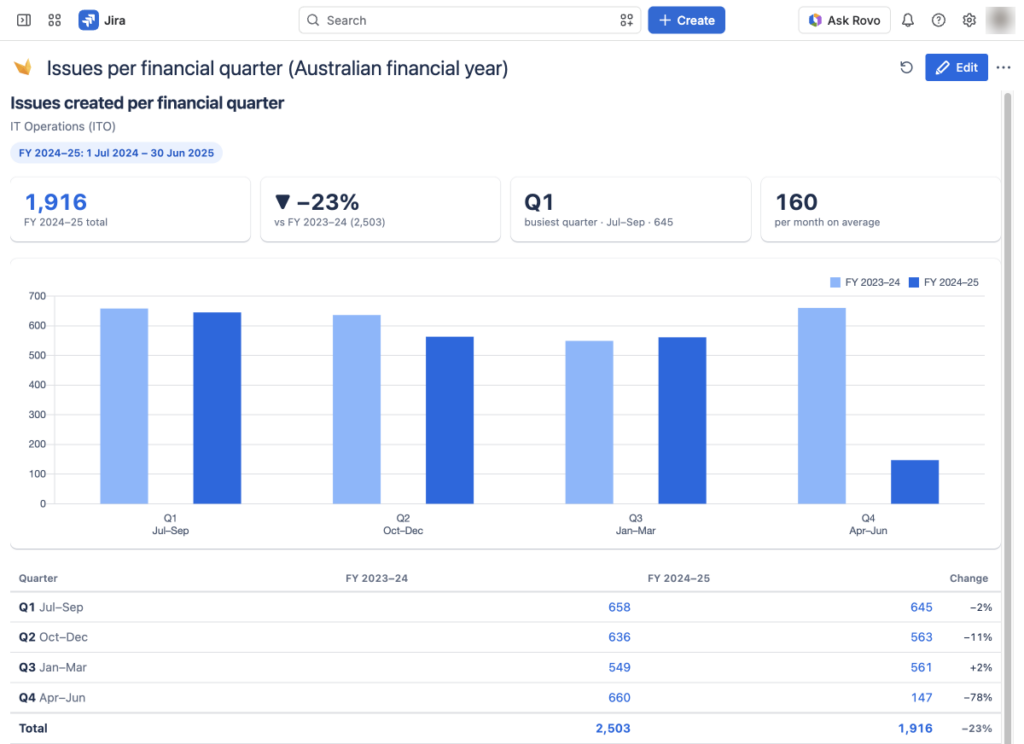
Here is what it shows for one of our demo service projects, financial year 2024–25:
- One bar per financial quarter, Q1 = July–September, with the previous financial year next to it.
- Tiles on top: the year’s total (1,916), the change against the previous year (−23%), the busiest quarter (Q1, 645) and the monthly average.
- A table with every number clickable. Each count opens exactly those tickets in Jira, so the chart and the issue search always agree.

Settings
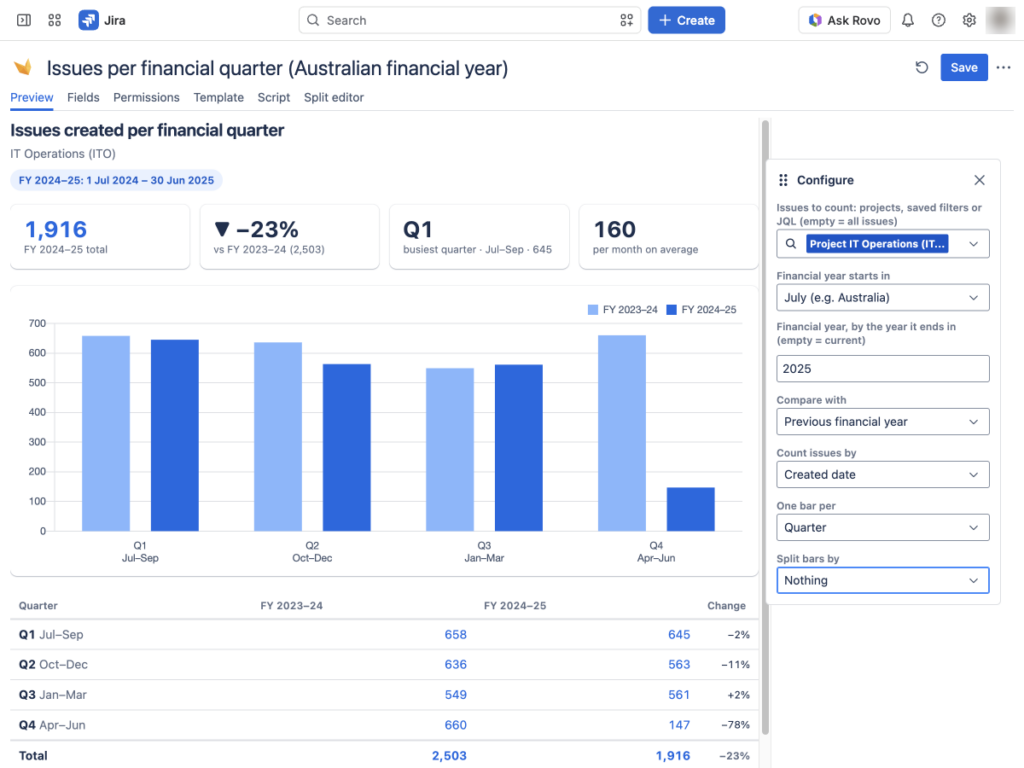
Everything is set in the report’s settings panel and saved with the report, so the dashboard shows the same view for everyone.
| Setting | Options | Default |
| Issues to count | Projects, saved filters or JQL | All issues you can see |
| Financial year starts in | Any month (July for Australia, April for the UK, India and Japan, October for the US federal government) | July |
| Financial year | The year it ends in: 2027 means 1 July 2026 – 30 June 2027 | Current |
| Compare with | Nothing, previous year, previous 2 years | Previous year |
| Count issues by | Created date or Resolved date | Created |
| One bar per | Quarter or month | Quarter |
| Split bars by | Request type, issue type, priority, status category, assignee | Nothing |
Split by request type
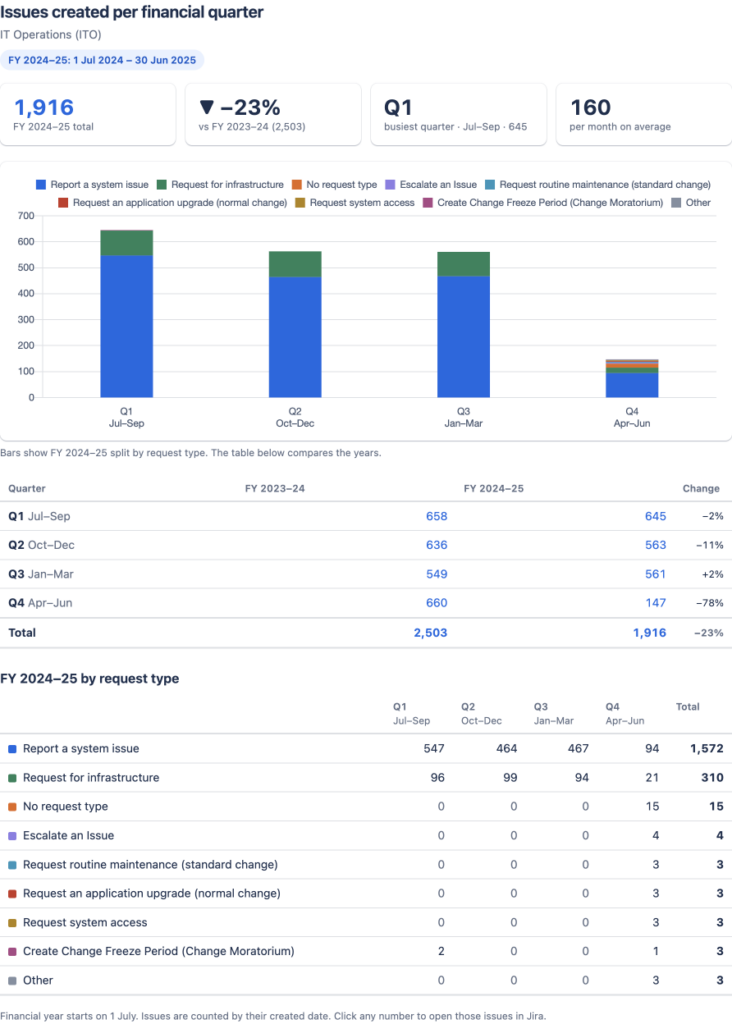
For a service desk, the next question after “how many” is “what kind”. Split the bars by request type and you also get a table with request types as rows and financial quarters as columns. In our demo project, “Report a system issue” accounts for 1,572 of the 1,916 tickets in FY 2024–25.
Monthly view
Switch to one bar per month to see the financial year from July to June, with the same comparison.
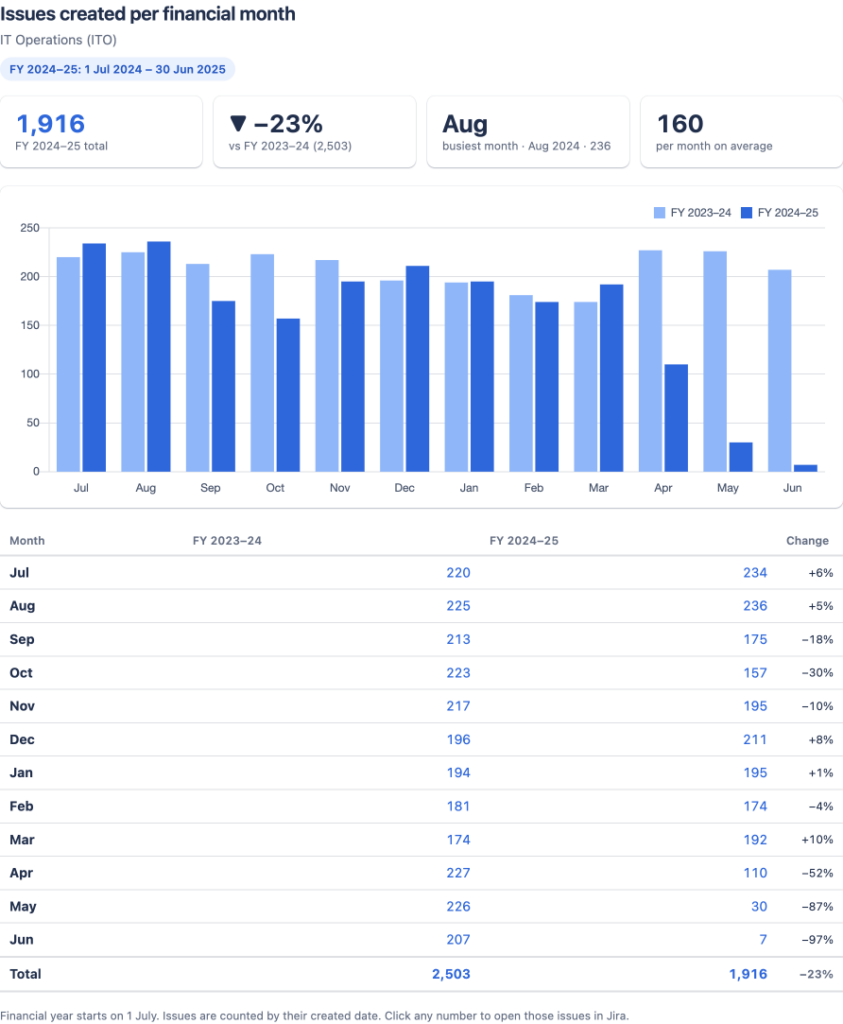
The current year, compared fairly
When the selected year is still running, comparing it with a full previous year would always look like a drop. The report compares it with the previous year up to the same day instead, and marks the running quarter as “so far”. Quarters that haven’t started are greyed out.
How to add it to your Jira
You can get this report in three ways.
- Ask the AI assistant. In Report Builder, open the assistant in Rovo, or connect your own AI client through MCP, and ask for “a bar chart of tickets per quarter of the Australian financial year, 1 July to 30 June, compared with last year”. It builds a draft for you to review and save.
- Paste the code. Create a new scripted report, then paste the script, the template and the input fields from the end of this post. Adding or editing a scripted report needs the Scripted Reports Creator permission.
- Ask us. We build custom reports for Report Builder customers for free: request a custom report.
Once it’s saved, you can add the report to a Jira dashboard like any other Report Builder report.
How the report counts
The whole trick is one function. A date belongs to the financial year that ends in the following calendar year if its month is on or after the start month:
// startMonth: 7 for July. Returns the financial year (by the year it ends in)

// and the month index 0–11 inside that year.

function bucket(dateStr, startMonth) {

  var y = +dateStr.slice(0, 4), m = +dateStr.slice(5, 7);

  var fy = startMonth === 1 ? y : (m >= startMonth ? y + 1 : y);

  return { fy: fy, k: (m - startMonth + 12) % 12 };   // quarter = Math.floor(k / 3) + 1

}
A few choices make the numbers trustworthy:
- Dates are bucketed by the calendar date Jira returns, not converted through the browser’s time zone. A ticket created at 23:30 on 30 June stays in Q4, exactly as JQL
created < "2025-07-01"sees it. - One query per report. The report fetches every ticket in the selected years once and counts them in the browser, so it stays quick on a few thousand tickets.
- Every number links to its JQL. If someone doubts a bar, one click shows the tickets behind it.
We tested the date logic for July, January, April and October starts, including tickets on the last and first day of a financial year. Then we checked the report in Jira against plain JQL counts, for a July and an April start: every quarter matched.
Full source code
The report has three parts: the input fields, the script and the template. Paste them into a new scripted report in Report Builder.
Input fields (code/fields.json)
[

  {

    "type": "14",

    "name": "scope",

    "title": "Issues to count: projects, saved filters or JQL (empty = all issues)",

    "order": 1,

    "defaultValue": {

      "scopePickerMode": "basicView",

      "projects": [],

      "epics": [],

      "issues": [],

      "filters": [],

      "jql": ""

    }

  },

  {

    "type": "13",

    "name": "fy-start",

    "title": "Financial year starts in",

    "optionsList": [

      "January",

      "February",

      "March",

      "April (e.g. UK, India, Japan)",

      "May",

      "June",

      "July (e.g. Australia)",

      "August",

      "September",

      "October (e.g. US federal government)",

      "November",

      "December"

    ],

    "isMulti": false,

    "order": 2,

    "defaultValue": "July (e.g. Australia)"

  },

  {

    "type": "1",

    "name": "fy-year",

    "title": "Financial year, by the year it ends in (empty = current)",

    "order": 3,

    "defaultValue": ""

  },

  {

    "type": "13",

    "name": "compare",

    "title": "Compare with",

    "optionsList": [

      "Nothing",

      "Previous financial year",

      "Previous 2 financial years"

    ],

    "isMulti": false,

    "order": 4,

    "defaultValue": "Previous financial year"

  },

  {

    "type": "13",

    "name": "date-field",

    "title": "Count issues by",

    "optionsList": [

      "Created date",

      "Resolved date"

    ],

    "isMulti": false,

    "order": 5,

    "defaultValue": "Created date"

  },

  {

    "type": "13",

    "name": "period",

    "title": "One bar per",

    "optionsList": [

      "Quarter",

      "Month"

    ],

    "isMulti": false,

    "order": 6,

    "defaultValue": "Quarter"

  },

  {

    "type": "13",

    "name": "split",

    "title": "Split bars by",

    "optionsList": [

      "Nothing",

      "Request type",

      "Issue type",

      "Priority",

      "Status category",

      "Assignee"

    ],

    "isMulti": false,

    "order": 7,

    "defaultValue": "Nothing"

  }

]
Script (code/script.js)
/**
* Financial year report: issues per financial quarter (or month) for any financial year,
* for example the Australian financial year (1 July to 30 June).
*
* Settings:
* scope Which issues to count: projects, saved filters or JQL (empty = all issues you can see)
* fy-start The month the financial year starts in (July for Australia)
* fy-year The financial year to show, by the year it ENDS in (2027 = 1 Jul 2026 – 30 Jun 2027). Empty = current
* compare Also show the previous one or two financial years
* date-field Count issues by Created or by Resolved date
* period One bar per financial quarter or per month
* split Split the bars of the selected year by request type, issue type, priority, status category or assignee
*
* Dates are bucketed by the calendar date Jira returns (YYYY-MM-DD in your Jira time zone),
* the same way JQL compares dates, so the numbers match the "Open in Jira" links.
*/
var U = {};
U.esc = function (s) {
return String(s == null ? '' : s).replace(/&/g, '&').replace(/</g, '<').replace(/>/g, '>')
.replace(/"/g, '"').replace(/'/g, ''');
};
U.text = function (raw) {
var s = String(raw == null ? '' : raw).trim();
if (/^".*"$/.test(s)) { try { s = String(JSON.parse(s)).trim(); } catch (e) { s = s.slice(1, -1).trim(); } }
return s;
};
U.getJson = async function (path) {
if (!SR.request) return null;
try {
var r = await SR.request(path, { method: 'GET' });
if (!r || r.ok === false) return null;
return typeof r.json === 'function' ? await r.json() : r;
} catch (e) { return null; }
};
// Select values may come back slugified ("request-type"): compare them in a normalised form.
U.norm = function (raw) { return U.text(raw).toLowerCase().replace(/[-_]+/g, ' ').replace(/\s+/g, ' ').trim(); };
// Type 14 "Filter by" usually returns a ready JQL string, sometimes the stored picker object.
U.scopeJql = function (raw) {
var jql = '';
if (typeof raw === 'string') jql = raw.trim();
else if (raw && typeof raw === 'object') {
if (raw.jql && String(raw.jql).trim()) jql = String(raw.jql).trim();
else {
var parts = [];
if (Array.isArray(raw.projects) && raw.projects.length)
parts.push('project in (' + raw.projects.map(function (p) { return '"' + (p.value != null ? p.value : p) + '"'; }).join(',') + ')');
if (Array.isArray(raw.filters) && raw.filters.length)
parts.push(raw.filters.map(function (f) { return f.type === 'predefinedFilter' ? '(' + f.value + ')' : 'filter = ' + f.value; }).join(' AND '));
if (Array.isArray(raw.issues) && raw.issues.length)
parts.push('issue in (' + raw.issues.map(function (i) { return i.value; }).join(',') + ')');
jql = parts.join(' AND ');
}
}
return jql.replace(/\s+order\s+by\s+[\s\S]*$/i, '').trim();
};
U.scopeLabel = function (data, jql) {
if (data && typeof data === 'object' && data.scopePickerMode !== 'jql') {
var bits = [];
['projects', 'epics', 'issues', 'filters'].forEach(function (k) {
(Array.isArray(data[k]) ? data[k] : []).forEach(function (x) { if (x && x.label) bits.push(x.label); });
});
if (bits.length) return bits.join(', ');
}
if (!jql) return 'All issues you can see';
return jql.length > 120 ? jql.slice(0, 117) + '…' : jql;
};
// ---------------------------------------------------------------- financial year maths
var MONTHS = ['Jan', 'Feb', 'Mar', 'Apr', 'May', 'Jun', 'Jul', 'Aug', 'Sep', 'Oct', 'Nov', 'Dec'];
var MONTHS_LONG = ['January', 'February', 'March', 'April', 'May', 'June', 'July', 'August', 'September', 'October', 'November', 'December'];
var pad = function (n) { return (n < 10 ? '0' : '') + n; };
var FY = {};
FY.init = function (startMonth) { FY.m0 = startMonth; }; // 1..12
// The financial year a calendar date belongs to, named by the year it ends in.
FY.endYearOf = function (y, m) { return FY.m0 === 1 ? y : (m >= FY.m0 ? y + 1 : y); };
FY.startOf = function (endYear) { return FY.m0 === 1 ? endYear + '-01-01' : (endYear - 1) + '-' + pad(FY.m0) + '-01'; };
FY.endOf = function (endYear) { return FY.m0 === 1 ? (endYear + 1) + '-01-01' : endYear + '-' + pad(FY.m0) + '-01'; }; // exclusive
FY.label = function (endYear) { return FY.m0 === 1 ? 'FY ' + endYear : 'FY ' + (endYear - 1) + '–' + String(endYear).slice(2); };
// k-th month of the financial year (0..11) -> {y, m}
FY.monthAt = function (endYear, k) {
var y = FY.m0 === 1 ? endYear : endYear - 1;
var m = FY.m0 + k;
if (m > 12) { m -= 12; y += 1; }
return { y: y, m: m };
};
FY.monthStart = function (endYear, k) { var a = FY.monthAt(endYear, k); return a.y + '-' + pad(a.m) + '-01'; };
FY.monthEnd = function (endYear, k) { // exclusive
if (k === 11) return FY.endOf(endYear);
return FY.monthStart(endYear, k + 1);
};
// Bucket of a 'YYYY-MM-DD…' string: { fy, k } where k is the month index in the financial year
FY.bucket = function (dateStr) {
var y = +dateStr.slice(0, 4), m = +dateStr.slice(5, 7);
return { fy: FY.endYearOf(y, m), k: (m - FY.m0 + 12) % 12 };
};
FY.dayLabel = function (iso) { return (+iso.slice(8, 10)) + ' ' + MONTHS[+iso.slice(5, 7) - 1] + ' ' + iso.slice(0, 4); };
FY.lastDay = function (exclusiveIso) { // the day before an exclusive end date
var p = exclusiveIso.split('-');
var d = new Date(Date.UTC(+p[0], +p[1] - 1, +p[2]) - 86400000);
return d.getUTCFullYear() + '-' + pad(d.getUTCMonth() + 1) + '-' + pad(d.getUTCDate());
};
// ---------------------------------------------------------------- settings
var scopeRaw = await SR.fields.getValueByFieldName('scope');
var scopeData = null;
try { scopeData = SR.fields.getDataByFieldName ? await SR.fields.getDataByFieldName('scope') : null; } catch (e) { scopeData = null; }
var scopeJql = U.scopeJql(scopeRaw);
if (!scopeData && scopeRaw && typeof scopeRaw === 'object') scopeData = scopeRaw;
var startText = U.norm(await SR.fields.getValueByFieldName('fy-start')) || 'july';
var startMonth = 0;
MONTHS_LONG.forEach(function (m, x) { if (startText.indexOf(m.toLowerCase()) === 0) startMonth = x + 1; });
if (startMonth < 1) startMonth = 7;
FY.init(startMonth);
var yearRaw = U.text(await SR.fields.getValueByFieldName('fy-year'));
var compareText = U.norm(await SR.fields.getValueByFieldName('compare'));
var dateText = U.norm(await SR.fields.getValueByFieldName('date-field'));
var periodText = U.norm(await SR.fields.getValueByFieldName('period'));
var splitText = U.norm(await SR.fields.getValueByFieldName('split'));
var byResolved = dateText.indexOf('resolved') >= 0;
var dateField = byResolved ? 'resolutiondate' : 'created';
var dateJql = byResolved ? 'resolved' : 'created';
var monthly = periodText.indexOf('month') >= 0;
var compareN = compareText.indexOf('2') >= 0 ? 2 : (compareText.indexOf('previous') >= 0 ? 1 : 0);
var split = /request/.test(splitText) ? 'requestType' : /issue type/.test(splitText) ? 'issuetype'
: /priority/.test(splitText) ? 'priority' : /status/.test(splitText) ? 'statusCategory'
: /assignee/.test(splitText) ? 'assignee' : '';
var now = new Date();
var todayIso = now.getFullYear() + '-' + pad(now.getMonth() + 1) + '-' + pad(now.getDate());
var currentFy = FY.endYearOf(now.getFullYear(), now.getMonth() + 1);
var fyYear = parseInt(String(yearRaw).replace(/[^0-9]/g, ''), 10);
if (!fyYear || fyYear < 1990 || fyYear > 2100) fyYear = currentFy;
if (fyYear > currentFy) throw { srError: 'The financial year ending in ' + fyYear + ' has not started yet. Leave the year empty to show the current financial year.' };
var years = [];
for (var i = compareN; i >= 0; i--) years.push(fyYear - i); // oldest first
var rangeStart = FY.startOf(years[0]);
var rangeEnd = FY.endOf(fyYear);
// ---------------------------------------------------------------- request type field (Jira Service Management)
var rtField = null;
if (split === 'requestType') {
var fieldList = null;
try { fieldList = SR.jira.getIssueFields ? await SR.jira.getIssueFields() : null; } catch (e) { fieldList = null; }
if (!Array.isArray(fieldList)) fieldList = await U.getJson('/rest/api/3/field');
(Array.isArray(fieldList) ? fieldList : []).some(function (f) {
if (f && f.schema && f.schema.custom === 'com.atlassian.servicedesk:vp-origin') { rtField = f.id; return true; }
return false;
});
if (!rtField) split = 'issuetype'; // not a service desk site: fall back to issue type
}
var splitLabel = { requestType: 'request type', issuetype: 'issue type', priority: 'priority', statusCategory: 'status category', assignee: 'assignee' }[split] || '';
// ---------------------------------------------------------------- fetch
var inScope = function (jql) { return scopeJql ? '(' + scopeJql + ') AND ' + jql : jql; };
var rangeJql = function (from, to) { return dateJql + ' >= "' + from + '" AND ' + dateJql + ' < "' + to + '"'; };
var fields = [dateField];
if (split === 'requestType') fields.push(rtField);
if (split === 'issuetype') fields.push('issuetype');
if (split === 'priority') fields.push('priority');
if (split === 'statusCategory') fields.push('status');
if (split === 'assignee') fields.push('assignee');
var issues = await SR.jira.getIssuesByJQL(inScope(rangeJql(rangeStart, rangeEnd)), fields.join(','), '');
if (!Array.isArray(issues)) issues = [];
var splitOf = function (f) {
if (split === 'requestType') { var v = f[rtField]; return { name: v && v.requestType && v.requestType.name ? v.requestType.name : 'No request type', jql: null }; }
if (split === 'issuetype') return f.issuetype ? { name: f.issuetype.name, jql: 'issuetype = "' + f.issuetype.name.replace(/"/g, '\\"') + '"' } : { name: 'Unknown', jql: null };
if (split === 'priority') return f.priority ? { name: f.priority.name, jql: 'priority = "' + f.priority.name.replace(/"/g, '\\"') + '"' } : { name: 'No priority', jql: 'priority is EMPTY' };
if (split === 'statusCategory') {
var c = f.status && f.status.statusCategory;
return c ? { name: c.name, jql: 'statusCategory = ' + c.id } : { name: 'Unknown', jql: null };
}
if (split === 'assignee') return f.assignee ? { name: f.assignee.displayName, jql: 'assignee = "' + f.assignee.accountId + '"' } : { name: 'Unassigned', jql: 'assignee is EMPTY' };
return null;
};
// ---------------------------------------------------------------- count
var nB = monthly ? 12 : 4;
var bucketOfK = function (k) { return monthly ? k : Math.floor(k / 3); };
var counts = {}; // fy -> [nB]
years.forEach(function (y) { counts[y] = []; for (var b = 0; b < nB; b++) counts[y].push(0); });
var splitCounts = {}; // name -> { jql, cells[nB], total }
var sameDayLastYear = {}; // fy -> count up to the same day of the year as today
var skipped = 0;
// "Same point last year" for an in-progress year: today's month/day one, two… years back.
var shiftIso = function (iso, back) {
var y = +iso.slice(0, 4) - back, md = iso.slice(5, 10);
if (md === '02-29') md = '02-28';
return y + '-' + md;
};
var inProgress = fyYear === currentFy;
issues.forEach(function (it) {
var f = it.fields || {};
var d = f[dateField];
if (!d || typeof d !== 'string') { skipped++; return; }
var b = FY.bucket(d);
if (!counts[b.fy]) { skipped++; return; }
var bi = bucketOfK(b.k);
counts[b.fy][bi]++;
if (inProgress) {
var back = fyYear - b.fy;
if (d.slice(0, 10) <= shiftIso(todayIso, back)) sameDayLastYear[b.fy] = (sameDayLastYear[b.fy] || 0) + 1;
}
if (split && b.fy === fyYear) {
var s = splitOf(f);
if (!splitCounts[s.name]) { splitCounts[s.name] = { name: s.name, jql: s.jql, cells: [], total: 0 }; for (var z = 0; z < nB; z++) splitCounts[s.name].cells.push(0); }
splitCounts[s.name].cells[bi]++;
splitCounts[s.name].total++;
}
});
// ---------------------------------------------------------------- buckets and labels
var buckets = [];
for (var bb = 0; bb < nB; bb++) {
var k0 = monthly ? bb : bb * 3, k1 = monthly ? bb : bb * 3 + 2;
var from = FY.monthStart(fyYear, k0), to = FY.monthEnd(fyYear, k1);
var a0 = FY.monthAt(fyYear, k0), a1 = FY.monthAt(fyYear, k1);
var state = to <= todayIso ? 'done' : (from <= todayIso ? 'running' : 'future');
buckets.push({
i: bb,
short: monthly ? MONTHS[a0.m - 1] : 'Q' + (bb + 1),
// Months need no range in rows and on the axis: the columns are financial years.
range: monthly ? '' : MONTHS[a0.m - 1] + '–' + MONTHS[a1.m - 1],
full: monthly ? MONTHS[a0.m - 1] + ' ' + a0.y : MONTHS[a0.m - 1] + '–' + MONTHS[a1.m - 1],
state: state,
k0: k0, k1: k1
});
}
var bucketRange = function (fy, b) { return { from: FY.monthStart(fy, b.k0), to: FY.monthEnd(fy, b.k1) }; };
var totals = {};
years.forEach(function (y) { totals[y] = counts[y].reduce(function (s, n) { return s + n; }, 0); });
// Split rows: biggest first, top 8 + "Other"
var splitRows = Object.keys(splitCounts).map(function (k) { return splitCounts[k]; })
.sort(function (a, b) { return b.total - a.total; });
if (splitRows.length > 9) {
var other = { name: 'Other', jql: null, cells: [], total: 0, other: true };
for (var o = 0; o < nB; o++) other.cells.push(0);
splitRows.slice(8).forEach(function (r) { r.cells.forEach(function (n, x) { other.cells[x] += n; }); other.total += r.total; });
splitRows = splitRows.slice(0, 8).concat([other]);
}
var baseUrl = '';
try { baseUrl = await SR.jira.getHostBaseUrl(); } catch (e) { baseUrl = ''; }
var jiraLink = function (jql) { return baseUrl + '/issues/?jql=' + encodeURIComponent(inScope(jql) + ' ORDER BY ' + dateJql + ' ASC'); };
var cur = counts[fyYear];
var elapsed = buckets.filter(function (b) { return b.state !== 'future'; });
var busiest = elapsed.slice().sort(function (a, b) { return cur[b.i] - cur[a.i]; })[0];
var monthsElapsed = 0;
for (var mk = 0; mk < 12; mk++) if (FY.monthStart(fyYear, mk) <= todayIso) monthsElapsed++;
var prevY = fyYear - 1;
var prevTotal = compareN ? (inProgress ? (sameDayLastYear[prevY] || 0) : totals[prevY]) : null;
var curTotal = totals[fyYear];
var change = prevTotal ? Math.round((curTotal - prevTotal) / prevTotal * 100) : null;
var startIso = FY.startOf(fyYear);
var lastIso = FY.lastDay(FY.endOf(fyYear));
var fyText = FY.label(fyYear) + ': ' + FY.dayLabel(startIso) + ' – ' + FY.dayLabel(lastIso);
// ---------------------------------------------------------------- render
SR.render({
title: 'Issues ' + (byResolved ? 'resolved' : 'created') + ' per financial ' + (monthly ? 'month' : 'quarter'),
fyText: fyText,
scopeText: U.scopeLabel(scopeData, scopeJql),
startMonthName: MONTHS_LONG[startMonth - 1]
}, function () {
var root = document.getElementById('fyr');
if (!root) return;
var css = getComputedStyle(root);
var cv = function (name, fb) { var v = css.getPropertyValue(name).trim(); return v || fb; };
var num = function (n) { return Number(n).toLocaleString('en-AU'); };
var pct = function (c, p) { var v = Math.round((c - p) / p * 100); return (v > 0 ? '+' + v : v < 0 ? '−' + (-v) : '0') + '%'; };
var link = function (n, jql, title) {
return '<a href="' + U.esc(jiraLink(jql)) + '" target="_blank" rel="noopener" title="' + U.esc(title) + '">' + num(n) + '</a>';
};
// KPI tiles
var tiles = [];
tiles.push('<div class="fyr-card fyr-main"><b>' + num(curTotal) + '</b><span>' + U.esc(FY.label(fyYear)) + (inProgress ? ' so far' : ' total') + '</span></div>');
if (compareN) {
var cls = change == null ? '' : change > 0 ? ' fyr-up' : change < 0 ? ' fyr-down' : '';
var ch = change == null ? '–' : (change > 0 ? '▲ +' + change : change < 0 ? '▼ −' + (-change) : '0') + '%';
tiles.push('<div class="fyr-card' + cls + '"><b>' + ch + '</b><span>vs ' + U.esc(FY.label(prevY)) + (inProgress ? ' at the same point (' + num(prevTotal) + ')' : ' (' + num(prevTotal) + ')') + '</span></div>');
}
if (busiest && cur[busiest.i] > 0)
tiles.push('<div class="fyr-card"><b>' + U.esc(busiest.short) + '</b><span>busiest ' + (monthly ? 'month' : 'quarter') + ' · ' + U.esc(busiest.full) + ' · ' + num(cur[busiest.i]) + '</span></div>');
var avg = monthsElapsed ? curTotal / monthsElapsed : 0;
tiles.push('<div class="fyr-card"><b>' + (avg && avg < 10 ? avg.toFixed(1) : num(Math.round(avg))) + '</b><span>per month on average' + (inProgress ? ' (' + monthsElapsed + ' months so far)' : '') + '</span></div>');
root.querySelector('.fyr-cards').innerHTML = tiles.join('');
// Chart
var palette = ['#0C66E4', '#1F845A', '#E56910', '#8F7EE7', '#2898BD', '#CA3521', '#B38600', '#AE4787', '#8590A2'];
var fyColors = { 0: cv('--fyr-bar-cur', '#0C66E4'), 1: cv('--fyr-bar-prev', '#85B8FF'), 2: cv('--fyr-bar-prev2', '#B3B9C4') };
var labels = buckets.map(function (b) { var l = b.short + (b.state === 'running' ? ' (so far)' : ''); return b.range ? [l, b.range] : l; });
var datasets;
if (split && splitRows.length) {
datasets = splitRows.map(function (r, x) {
return { label: r.name, data: r.cells, backgroundColor: r.other ? '#8590A2' : palette[x % palette.length], stack: 'one', borderRadius: 2, maxBarThickness: 64 };
});
} else {
datasets = years.map(function (y) {
var back = fyYear - y;
return { label: FY.label(y), data: counts[y], backgroundColor: fyColors[back], borderRadius: 3, maxBarThickness: 56 };
});
}
var Chart = SR.lib && SR.lib.Chart;
var canvas = root.querySelector('canvas');
if (Chart && canvas) {
var text = cv('--fyr-text-subtle', '#44546F'), grid = cv('--fyr-border', '#DCDFE4');
var stacked = !!split;
var tooltipTitle = function (items) { var b = buckets[items[0].dataIndex != null ? items[0].dataIndex : items[0].index]; return monthly ? b.full : b.short + ' · ' + b.range; };
// Report Builder may bundle Chart.js 2 or a newer major version; their axis options differ.
var legacy = typeof Chart.register !== 'function';
var options = legacy ? {
responsive: true, maintainAspectRatio: false, animation: false,
legend: { position: 'top', align: 'end', labels: { fontColor: text, boxWidth: 12 } },
tooltips: { callbacks: { title: tooltipTitle } },
scales: {
xAxes: [{ stacked: stacked, ticks: { fontColor: text, fontSize: 12 }, gridLines: { display: false } }],
yAxes: [{ stacked: stacked, ticks: { beginAtZero: true, min: 0, precision: 0, fontColor: text }, gridLines: { color: grid, zeroLineColor: grid } }]
}
} : {
responsive: true, maintainAspectRatio: false, animation: false,
plugins: {
legend: { position: 'top', align: 'end', labels: { color: text, boxWidth: 12, boxHeight: 12 } },
tooltip: { callbacks: { title: tooltipTitle } }
},
scales: {
x: { stacked: stacked, ticks: { color: text, font: { size: 12 } }, grid: { display: false } },
y: { stacked: stacked, beginAtZero: true, min: 0, ticks: { color: text, precision: 0 }, grid: { color: grid } }
}
};
new Chart(canvas.getContext('2d'), { type: 'bar', data: { labels: labels, datasets: datasets }, options: options });
} else if (canvas) {
canvas.parentNode.innerHTML = '<p class="fyr-note">Chart library not available.</p>';
}
var splitNote = root.querySelector('.fyr-split-note');
if (split && compareN) splitNote.textContent = 'Bars show ' + FY.label(fyYear) + ' split by ' + splitLabel + '. The table below compares the years.';
else splitNote.style.display = 'none';
// Period table: one row per quarter/month, one column per financial year (+ change)
var h = ['<table class="fyr-table"><thead><tr><th>' + (monthly ? 'Month' : 'Quarter') + '</th>'];
years.forEach(function (y, x) {
h.push('<th class="fyr-num">' + U.esc(FY.label(y)) + '</th>');
if (x > 0) h.push('<th class="fyr-num fyr-chg">Change</th>');
});
h.push('</tr></thead><tbody>');
buckets.forEach(function (b) {
h.push('<tr' + (b.state === 'future' ? ' class="fyr-future"' : '') + '><td><b>' + U.esc(b.short) + '</b> <span class="fyr-muted">' + U.esc(b.range) + (b.state === 'running' ? (b.range ? ' · ' : '') + 'so far' : '') + '</span></td>');
years.forEach(function (y, x) {
var r = bucketRange(y, b);
var isFuture = y === fyYear && b.state === 'future';
h.push('<td class="fyr-num">' + (isFuture ? '<span class="fyr-muted">–</span>' : link(counts[y][b.i], rangeJql(r.from, r.to), FY.label(y) + ' ' + b.short + ': ' + FY.dayLabel(r.from) + ' – ' + FY.dayLabel(FY.lastDay(r.to)))) + '</td>');
if (x > 0) {
var p = counts[years[x - 1]][b.i], c = counts[y][b.i];
var txt = isFuture || !p || (y === fyYear && b.state === 'running') ? '' : pct(c, p);
var cl = !txt ? '' : c > p ? ' fyr-up' : c < p ? ' fyr-down' : '';
h.push('<td class="fyr-num fyr-chg' + cl + '">' + txt + '</td>');
}
});
h.push('</tr>');
});
h.push('</tbody><tfoot><tr><td>Total</td>');
years.forEach(function (y, x) {
h.push('<td class="fyr-num">' + link(totals[y], rangeJql(FY.startOf(y), FY.endOf(y)), FY.label(y)) + '</td>');
if (x > 0) {
var p = totals[years[x - 1]], c = totals[y];
var txt = !p || (y === fyYear && inProgress) ? '' : pct(c, p);
h.push('<td class="fyr-num fyr-chg">' + txt + '</td>');
}
});
h.push('</tr></tfoot></table>');
root.querySelector('.fyr-period').innerHTML = h.join('');
// Split table for the selected year
var sp = root.querySelector('.fyr-split');
if (split && splitRows.length) {
var t = ['<h3>' + U.esc(FY.label(fyYear)) + ' by ' + U.esc(splitLabel) + '</h3><div class="fyr-scroll"><table class="fyr-table"><thead><tr><th></th>'];
buckets.forEach(function (b) { t.push('<th class="fyr-num">' + U.esc(b.short) + (b.range ? '<br><span class="fyr-muted">' + U.esc(b.range) + '</span>' : '') + '</th>'); });
t.push('<th class="fyr-num">Total</th></tr></thead><tbody>');
splitRows.forEach(function (r, x) {
t.push('<tr><td><i class="fyr-dot" style="background:' + (r.other ? '#8590A2' : palette[x % palette.length]) + '"></i>' + U.esc(r.name) + '</td>');
r.cells.forEach(function (n, bi) {
var b = buckets[bi], rg = bucketRange(fyYear, b);
var cellJql = r.jql ? rangeJql(rg.from, rg.to) + ' AND ' + r.jql : null;
t.push('<td class="fyr-num">' + (b.state === 'future' ? '<span class="fyr-muted">–</span>' : !n ? '<span class="fyr-muted">0</span>' : cellJql ? link(n, cellJql, r.name + ', ' + b.short) : num(n)) + '</td>');
});
t.push('<td class="fyr-num"><b>' + (r.jql ? link(r.total, rangeJql(FY.startOf(fyYear), FY.endOf(fyYear)) + ' AND ' + r.jql, r.name) : num(r.total)) + '</b></td></tr>');
});
t.push('</tbody></table></div>');
sp.innerHTML = t.join('');
} else sp.style.display = 'none';
var notes = [];
notes.push('Financial year starts on 1 ' + MONTHS_LONG[startMonth - 1] + '. Issues are counted by their ' + (byResolved ? 'resolved' : 'created') + ' date. Click any number to open those issues in Jira.');
if (inProgress && compareN) notes.push('Because ' + FY.label(fyYear) + ' is still running, the change is measured against ' + FY.label(prevY) + ' up to the same day (' + FY.dayLabel(shiftIso(todayIso, 1)) + ').');
if (byResolved) notes.push('Unresolved issues have no resolved date and are not counted.');
if (skipped) notes.push(num(skipped) + ' issue(s) without a ' + (byResolved ? 'resolved' : 'created') + ' date were skipped.');
root.querySelector('.fyr-note').innerHTML = notes.map(U.esc).join(' ');
});
Template (code/template.html)
<style>

#fyr { --fyr-text: var(--ds-text, #172B4D); --fyr-text-subtle: var(--ds-text-subtle, #44546F); --fyr-subtlest: var(--ds-text-subtlest, #626F86);

       --fyr-raised: var(--ds-surface-raised, #FFFFFF); --fyr-sunken: var(--ds-surface-sunken, #F7F8F9);

       --fyr-border: var(--ds-border, #DCDFE4); --fyr-link: var(--ds-link, #0C66E4);

       --fyr-shadow: var(--ds-shadow-raised, 0 1px 1px #091E4240, 0 0 1px #091E424F);

       --fyr-up: var(--ds-text, #172B4D); --fyr-down: var(--ds-text, #172B4D);

       --fyr-bar-cur: var(--ds-background-brand-bold, #0C66E4); --fyr-bar-prev: #85B8FF; --fyr-bar-prev2: #B3B9C4;

       font: 14px/1.45 -apple-system, BlinkMacSystemFont, 'Segoe UI', Roboto, 'Helvetica Neue', sans-serif; color: var(--fyr-text); }

#fyr * { box-sizing: border-box; }

#fyr table, #fyr button { font: inherit; color: inherit; }

#fyr a { color: var(--fyr-link); text-decoration: none; }

#fyr a:hover { text-decoration: underline; }

#fyr h2 { font-size: 20px; font-weight: 653; margin: 0 0 4px; letter-spacing: -0.01em; }

#fyr h3 { font-size: 16px; font-weight: 653; margin: 24px 0 8px; }

#fyr .fyr-sub { color: var(--fyr-subtlest); margin: 0; }

#fyr .fyr-fy { display: inline-block; margin: 8px 0 16px; padding: 4px 10px; border-radius: 999px; background: var(--ds-background-information, #E9F2FF);

               color: var(--ds-text-information, #0055CC); font-size: 12px; font-weight: 600; }

#fyr .fyr-cards { display: grid; grid-template-columns: repeat(auto-fit, minmax(170px, 1fr)); gap: 12px; margin: 0 0 20px; }

#fyr .fyr-card { background: var(--fyr-raised); box-shadow: var(--fyr-shadow); border-radius: 8px; padding: 14px 16px; }

#fyr .fyr-card b { display: block; font-size: 26px; line-height: 1.15; font-weight: 653; font-variant-numeric: tabular-nums; }

#fyr .fyr-card span { color: var(--fyr-subtlest); font-size: 12px; }

#fyr .fyr-card.fyr-main b { color: var(--fyr-link); }

#fyr .fyr-card.fyr-up b, #fyr td.fyr-up { color: var(--fyr-up); }

#fyr .fyr-card.fyr-down b, #fyr td.fyr-down { color: var(--fyr-down); }

#fyr .fyr-chart { position: relative; height: 340px; background: var(--fyr-raised); box-shadow: var(--fyr-shadow); border-radius: 8px; padding: 12px 16px 8px; }

#fyr .fyr-split-note { color: var(--fyr-subtlest); font-size: 12px; margin: 6px 0 0; }

#fyr .fyr-scroll { overflow-x: auto; }

#fyr .fyr-table { width: 100%; border-collapse: collapse; margin-top: 20px; font-variant-numeric: tabular-nums; }

#fyr .fyr-split .fyr-table { margin-top: 0; }

#fyr .fyr-table th { text-align: left; font-size: 12px; font-weight: 600; color: var(--fyr-subtlest); padding: 6px 10px; border-bottom: 2px solid var(--fyr-border); white-space: nowrap; }

#fyr .fyr-table td { padding: 7px 10px; border-bottom: 1px solid var(--fyr-border); white-space: nowrap; }

#fyr .fyr-table tfoot td { font-weight: 653; border-bottom: 0; border-top: 2px solid var(--fyr-border); }

#fyr .fyr-num { text-align: right; }

#fyr .fyr-chg { color: var(--fyr-subtlest); font-size: 12px; width: 70px; }

#fyr .fyr-muted { color: var(--fyr-subtlest); font-weight: 400; }

#fyr tr.fyr-future td { opacity: .55; }

#fyr .fyr-dot { display: inline-block; width: 10px; height: 10px; border-radius: 2px; margin-right: 8px; vertical-align: -1px; }

#fyr .fyr-note { color: var(--fyr-subtlest); font-size: 12px; margin: 16px 0 0; max-width: 820px; }

</style>

<div id="fyr">

  <h2>{{title}}</h2>

  <p class="fyr-sub">{{scopeText}}</p>

  <span class="fyr-fy">{{fyText}}</span>

  <div class="fyr-cards"></div>

  <div class="fyr-chart"><canvas></canvas></div>

  <p class="fyr-split-note"></p>

  <div class="fyr-period"></div>

  <div class="fyr-split"></div>

  <p class="fyr-note"></p>

</div>
Try it
- New to Report Builder? Get it on the Atlassian Marketplace.
- Read how to build reports with the Report Builder assistant in Rovo or from your own AI client via MCP.
- Need a different financial report? Request a custom report; it’s free for Report Builder customers.

 Request