Jiras User Workload Report wird eingestellt – so ersetzen (und verbessern) Sie ihn mit Report Builder
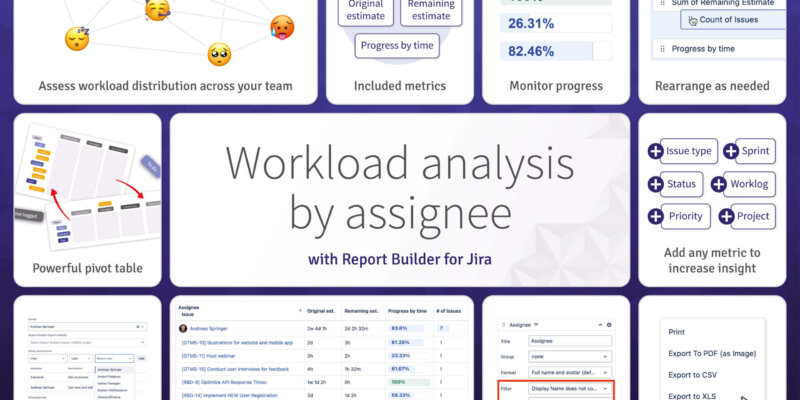
Atlassian is retiring Jira’s built-in User Workload Report, the report managers used to answer a simple question: how much unresolved work does each person have, and how long will it take? Atlassian’s suggested replacement is the workload pie chart gadget — which shows issue counts only: no remaining estimates, no per-project breakdown, no way to click through to the work behind a number.
If your team relies on this view — or you’ve been trying to get a workload report by assignee out of Jira any other way — you can rebuild it in Report Builder in about two minutes, and get a version with estimates, progress bars and drill-down that the original never had.
📚 There is already a full guide to this template. Our article „Jira workload by assignee“: keep track of your team’s workload and issues in Jira walks through the Workload Analysis template step by step, with screenshots and a video walkthrough. Read on here for what the retirement changes and how to match the old report exactly.
What the User Workload Report showed
For a selected user, the report listed each project they have unresolved work in, with two numbers per project: the count of unresolved issues and the total remaining estimate, plus an overall total. That’s it — useful, but locked to one user at a time and invisible on dashboards.
Why the other native options don't cover it
Teams asking for „workload by assignee with remaining estimate“ usually get pointed at two places, and both fall short:
- The board’s Workload by Assignee panel shows remaining time per person — but only for a single board’s active sprint or backlog. It cannot aggregate across projects, has no history, and can’t go on a dashboard. Showing richer estimates there has been an open Atlassian feature request for years.
- The workload pie chart gadget (Atlassian’s suggested replacement) counts issues per assignee — it cannot sum time estimates at all.
Rebuild it with the Workload template
- In Report Builder, create a new report from the Workload template in the gallery.
- Out of the box you get rows per assignee (expandable to individual issues) with four columns: Sum of Original Estimate, Sum of Remaining Estimate, a Progress by Time bar, and Count of Issues shown as a number plus its share of the total.
- Set the scope: pick projects in the scope picker, or switch the scope to JQL for the classic single-user view — e.g.
assignee = "Maria" AND resolution IS EMPTY. - To restore the old report’s per-project breakdown, add Project as a second row dimension (or as columns for a user × project matrix).
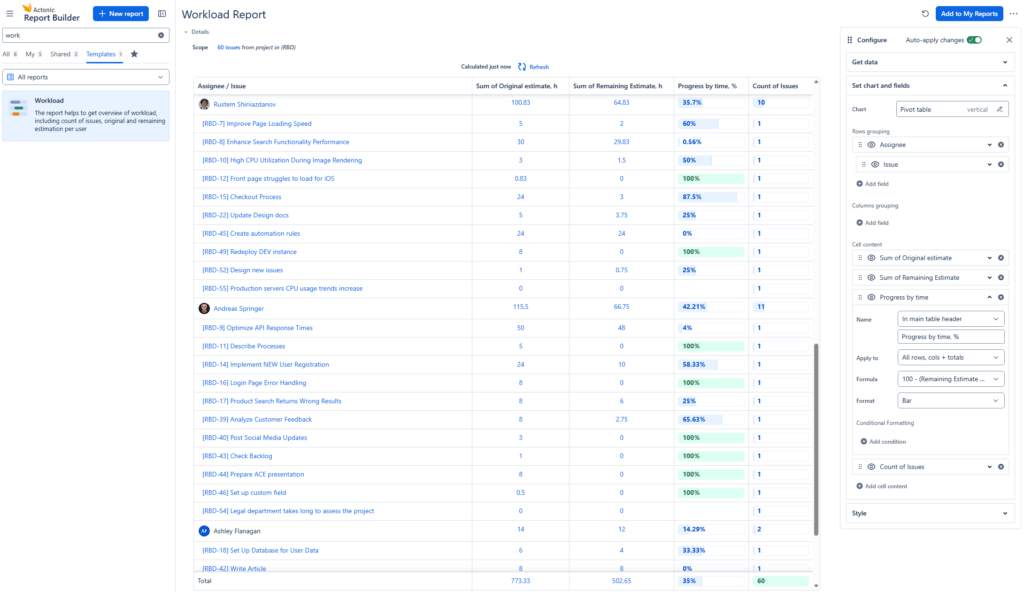
The Workload template is the same „Workload Analysis“ report we introduced in our Jira workload by assignee deep-dive — it walks through the template gallery, scope selection and the inline progress bars with screenshots and a video. This article focuses on what changes now that the native report is retiring; the deep-dive remains the full tour of the template.
Old report vs. the Report Builder version
| Capability | User Workload Report | Workload pie chart gadget | Report Builder Workload |
|---|---|---|---|
| Unresolved issue count per person | One user at a time | Yes (counts only) | All users at once |
| Remaining estimate | Yes | No | Yes, plus original estimate |
| Progress indication | No | No | Progress bar per person/issue |
| Per-project breakdown | Yes | No | Yes — any dimension, in fact |
| On a dashboard | No | Yes | Yes — as a gadget |
| Click through to the issues | No | No | Yes — drill-down from any cell |
Beyond parity: because this is a regular Report Builder report, you can swap the assignee dimension for teams, add sprint or due-date columns, switch to a chart, or place the whole thing on a Jira dashboard as a gadget next to the pie chart it replaces.

Frequently asked
Can I still see just one person’s workload? Yes — scope the report with JQL (assignee = … AND resolution IS EMPTY), or keep all assignees and use the row filter on the assignee dimension.
How do I see who on the team is overloaded? Sort the matrix by the Sum of Remaining Estimate column (one click on the column header) — the heaviest workload rises to the top. For capacity planning across sprints, add a Sprint or Due Date column dimension to see how the remaining work distributes over time.
What about the board’s „Workload by Assignee“ panel? It only covers one board’s current sprint or backlog. This report covers any scope — multiple projects, a JQL query, or a saved filter — and lives on dashboards.
Does it respect my working hours? Yes — durations render in Jira-style format („2d 4h“) using your configured working days and hours.
Can managers get this without opening the app? Yes — save the report and add it to any Jira dashboard as a Report Builder gadget.

 Unverbindlich